Immigrants from Norway vs Immigrants from Ireland Divorced or Separated
COMPARE
Immigrants from Norway
Immigrants from Ireland
Divorced or Separated
Divorced or Separated Comparison
Immigrants from Norway
Immigrants from Ireland
11.7%
DIVORCED OR SEPARATED
95.9/ 100
METRIC RATING
114th/ 347
METRIC RANK
11.0%
DIVORCED OR SEPARATED
100.0/ 100
METRIC RATING
30th/ 347
METRIC RANK
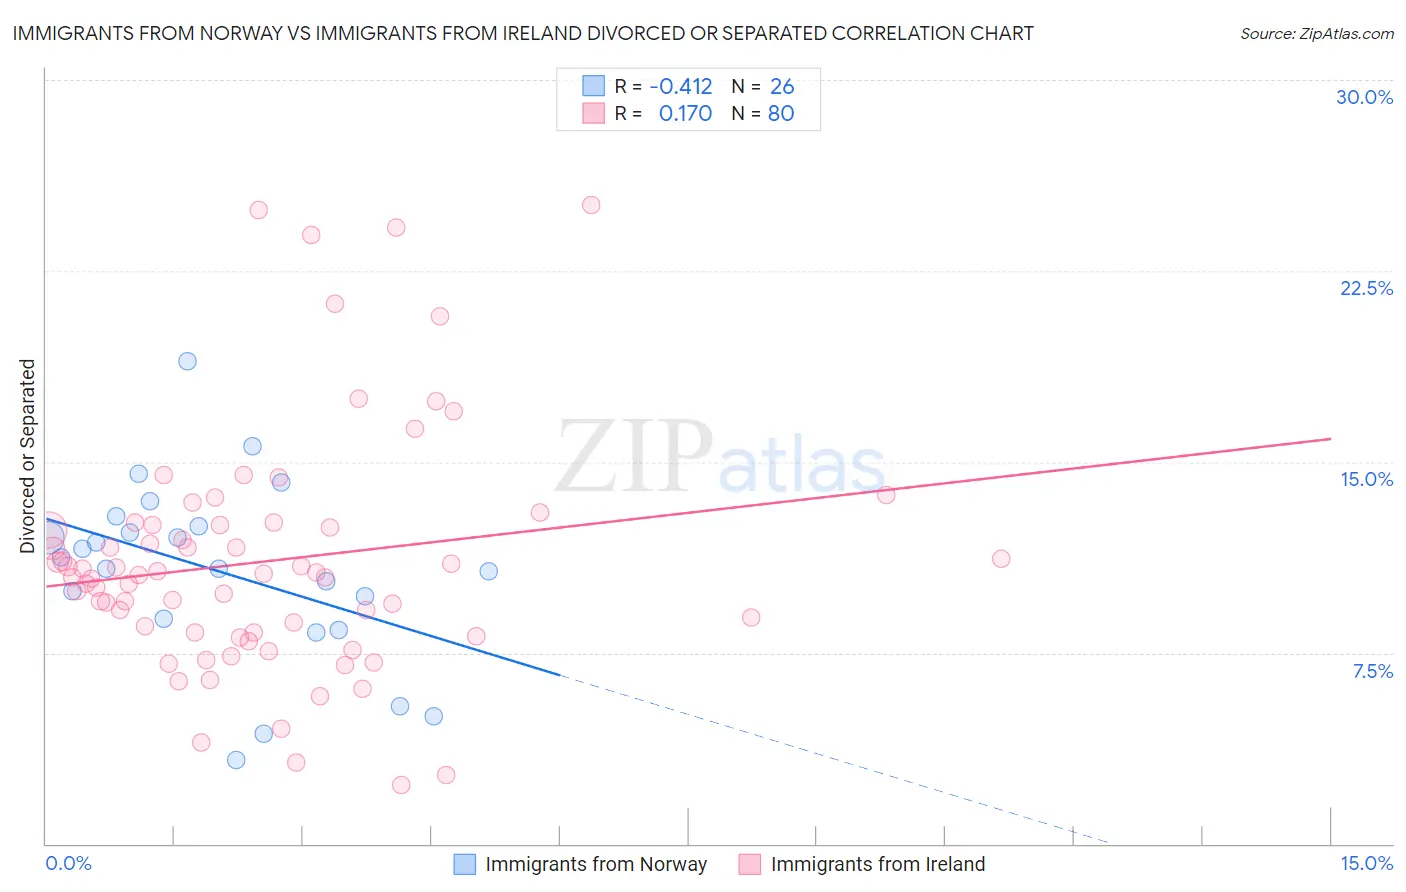
Immigrants from Norway vs Immigrants from Ireland Divorced or Separated Correlation Chart
The statistical analysis conducted on geographies consisting of 116,710,003 people shows a moderate negative correlation between the proportion of Immigrants from Norway and percentage of population currently divorced or separated in the United States with a correlation coefficient (R) of -0.412 and weighted average of 11.7%. Similarly, the statistical analysis conducted on geographies consisting of 240,767,381 people shows a poor positive correlation between the proportion of Immigrants from Ireland and percentage of population currently divorced or separated in the United States with a correlation coefficient (R) of 0.170 and weighted average of 11.0%, a difference of 6.3%.
Divorced or Separated Correlation Summary
| Measurement | Immigrants from Norway | Immigrants from Ireland |
| Minimum | 3.3% | 2.3% |
| Maximum | 18.9% | 25.1% |
| Range | 15.6% | 22.8% |
| Mean | 10.7% | 11.1% |
| Median | 11.0% | 10.6% |
| Interquartile 25% (IQ1) | 8.8% | 8.3% |
| Interquartile 75% (IQ3) | 12.5% | 12.5% |
| Interquartile Range (IQR) | 3.6% | 4.2% |
| Standard Deviation (Sample) | 3.6% | 4.7% |
| Standard Deviation (Population) | 3.5% | 4.6% |
Similar Demographics by Divorced or Separated
Demographics Similar to Immigrants from Norway by Divorced or Separated
In terms of divorced or separated, the demographic groups most similar to Immigrants from Norway are Lithuanian (11.7%, a difference of 0.050%), Immigrants from Iraq (11.7%, a difference of 0.12%), Immigrants from Uganda (11.7%, a difference of 0.13%), Ecuadorian (11.7%, a difference of 0.14%), and Immigrants from France (11.7%, a difference of 0.17%).
| Demographics | Rating | Rank | Divorced or Separated |
| Native Hawaiians | 97.2 /100 | #107 | Exceptional 11.7% |
| Greeks | 96.9 /100 | #108 | Exceptional 11.7% |
| Immigrants | South Africa | 96.9 /100 | #109 | Exceptional 11.7% |
| Immigrants | Czechoslovakia | 96.9 /100 | #110 | Exceptional 11.7% |
| Immigrants | Spain | 96.8 /100 | #111 | Exceptional 11.7% |
| Immigrants | France | 96.6 /100 | #112 | Exceptional 11.7% |
| Estonians | 96.6 /100 | #113 | Exceptional 11.7% |
| Immigrants | Norway | 95.9 /100 | #114 | Exceptional 11.7% |
| Lithuanians | 95.7 /100 | #115 | Exceptional 11.7% |
| Immigrants | Iraq | 95.4 /100 | #116 | Exceptional 11.7% |
| Immigrants | Uganda | 95.3 /100 | #117 | Exceptional 11.7% |
| Ecuadorians | 95.3 /100 | #118 | Exceptional 11.7% |
| Syrians | 95.1 /100 | #119 | Exceptional 11.7% |
| Iraqis | 94.6 /100 | #120 | Exceptional 11.8% |
| Romanians | 94.5 /100 | #121 | Exceptional 11.8% |
Demographics Similar to Immigrants from Ireland by Divorced or Separated
In terms of divorced or separated, the demographic groups most similar to Immigrants from Ireland are Mongolian (11.1%, a difference of 0.30%), Tongan (11.1%, a difference of 0.37%), Egyptian (11.1%, a difference of 0.42%), Immigrants from Uzbekistan (11.1%, a difference of 0.49%), and Armenian (11.0%, a difference of 0.52%).
| Demographics | Rating | Rank | Divorced or Separated |
| Immigrants | Pakistan | 100.0 /100 | #23 | Exceptional 10.8% |
| Immigrants | Sri Lanka | 100.0 /100 | #24 | Exceptional 10.8% |
| Iranians | 100.0 /100 | #25 | Exceptional 10.8% |
| Immigrants | Indonesia | 100.0 /100 | #26 | Exceptional 10.9% |
| Immigrants | Bangladesh | 100.0 /100 | #27 | Exceptional 11.0% |
| Immigrants | Malaysia | 100.0 /100 | #28 | Exceptional 11.0% |
| Armenians | 100.0 /100 | #29 | Exceptional 11.0% |
| Immigrants | Ireland | 100.0 /100 | #30 | Exceptional 11.0% |
| Mongolians | 100.0 /100 | #31 | Exceptional 11.1% |
| Tongans | 100.0 /100 | #32 | Exceptional 11.1% |
| Egyptians | 100.0 /100 | #33 | Exceptional 11.1% |
| Immigrants | Uzbekistan | 100.0 /100 | #34 | Exceptional 11.1% |
| Cambodians | 100.0 /100 | #35 | Exceptional 11.1% |
| Immigrants | Japan | 100.0 /100 | #36 | Exceptional 11.1% |
| Immigrants | Lebanon | 100.0 /100 | #37 | Exceptional 11.1% |