Sri Lankan vs Immigrants from Ireland Divorced or Separated
COMPARE
Sri Lankan
Immigrants from Ireland
Divorced or Separated
Divorced or Separated Comparison
Sri Lankans
Immigrants from Ireland
11.3%
DIVORCED OR SEPARATED
99.9/ 100
METRIC RATING
58th/ 347
METRIC RANK
11.0%
DIVORCED OR SEPARATED
100.0/ 100
METRIC RATING
30th/ 347
METRIC RANK
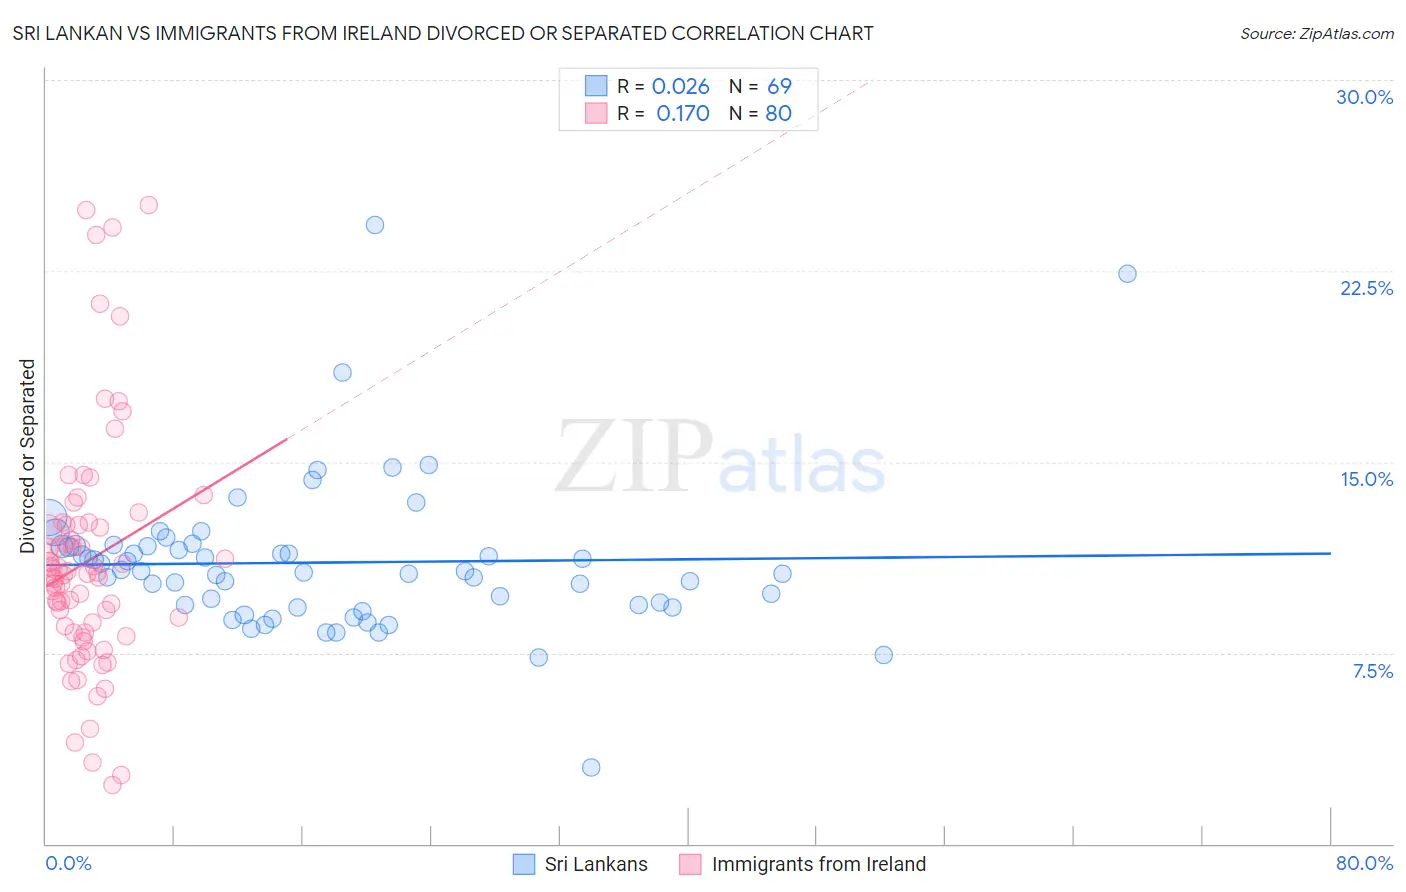
Sri Lankan vs Immigrants from Ireland Divorced or Separated Correlation Chart
The statistical analysis conducted on geographies consisting of 440,263,328 people shows no correlation between the proportion of Sri Lankans and percentage of population currently divorced or separated in the United States with a correlation coefficient (R) of 0.026 and weighted average of 11.3%. Similarly, the statistical analysis conducted on geographies consisting of 240,767,381 people shows a poor positive correlation between the proportion of Immigrants from Ireland and percentage of population currently divorced or separated in the United States with a correlation coefficient (R) of 0.170 and weighted average of 11.0%, a difference of 2.6%.
Divorced or Separated Correlation Summary
| Measurement | Sri Lankan | Immigrants from Ireland |
| Minimum | 3.0% | 2.3% |
| Maximum | 24.3% | 25.1% |
| Range | 21.3% | 22.8% |
| Mean | 11.0% | 11.1% |
| Median | 10.7% | 10.6% |
| Interquartile 25% (IQ1) | 9.3% | 8.3% |
| Interquartile 75% (IQ3) | 11.7% | 12.5% |
| Interquartile Range (IQR) | 2.4% | 4.2% |
| Standard Deviation (Sample) | 3.0% | 4.7% |
| Standard Deviation (Population) | 3.0% | 4.6% |
Similar Demographics by Divorced or Separated
Demographics Similar to Sri Lankans by Divorced or Separated
In terms of divorced or separated, the demographic groups most similar to Sri Lankans are Immigrants from Vietnam (11.3%, a difference of 0.060%), Immigrants from Philippines (11.3%, a difference of 0.070%), Israeli (11.3%, a difference of 0.10%), Eastern European (11.3%, a difference of 0.14%), and Immigrants from Yemen (11.3%, a difference of 0.14%).
| Demographics | Rating | Rank | Divorced or Separated |
| Immigrants | Bolivia | 100.0 /100 | #51 | Exceptional 11.3% |
| Immigrants | Australia | 99.9 /100 | #52 | Exceptional 11.3% |
| Immigrants | Lithuania | 99.9 /100 | #53 | Exceptional 11.3% |
| Eastern Europeans | 99.9 /100 | #54 | Exceptional 11.3% |
| Immigrants | Yemen | 99.9 /100 | #55 | Exceptional 11.3% |
| Immigrants | Philippines | 99.9 /100 | #56 | Exceptional 11.3% |
| Immigrants | Vietnam | 99.9 /100 | #57 | Exceptional 11.3% |
| Sri Lankans | 99.9 /100 | #58 | Exceptional 11.3% |
| Israelis | 99.9 /100 | #59 | Exceptional 11.3% |
| Immigrants | Russia | 99.9 /100 | #60 | Exceptional 11.3% |
| Koreans | 99.9 /100 | #61 | Exceptional 11.3% |
| Luxembourgers | 99.9 /100 | #62 | Exceptional 11.3% |
| Immigrants | Kuwait | 99.9 /100 | #63 | Exceptional 11.3% |
| Macedonians | 99.8 /100 | #64 | Exceptional 11.4% |
| Immigrants | South Eastern Asia | 99.8 /100 | #65 | Exceptional 11.4% |
Demographics Similar to Immigrants from Ireland by Divorced or Separated
In terms of divorced or separated, the demographic groups most similar to Immigrants from Ireland are Mongolian (11.1%, a difference of 0.30%), Tongan (11.1%, a difference of 0.37%), Egyptian (11.1%, a difference of 0.42%), Immigrants from Uzbekistan (11.1%, a difference of 0.49%), and Armenian (11.0%, a difference of 0.52%).
| Demographics | Rating | Rank | Divorced or Separated |
| Immigrants | Pakistan | 100.0 /100 | #23 | Exceptional 10.8% |
| Immigrants | Sri Lanka | 100.0 /100 | #24 | Exceptional 10.8% |
| Iranians | 100.0 /100 | #25 | Exceptional 10.8% |
| Immigrants | Indonesia | 100.0 /100 | #26 | Exceptional 10.9% |
| Immigrants | Bangladesh | 100.0 /100 | #27 | Exceptional 11.0% |
| Immigrants | Malaysia | 100.0 /100 | #28 | Exceptional 11.0% |
| Armenians | 100.0 /100 | #29 | Exceptional 11.0% |
| Immigrants | Ireland | 100.0 /100 | #30 | Exceptional 11.0% |
| Mongolians | 100.0 /100 | #31 | Exceptional 11.1% |
| Tongans | 100.0 /100 | #32 | Exceptional 11.1% |
| Egyptians | 100.0 /100 | #33 | Exceptional 11.1% |
| Immigrants | Uzbekistan | 100.0 /100 | #34 | Exceptional 11.1% |
| Cambodians | 100.0 /100 | #35 | Exceptional 11.1% |
| Immigrants | Japan | 100.0 /100 | #36 | Exceptional 11.1% |
| Immigrants | Lebanon | 100.0 /100 | #37 | Exceptional 11.1% |