Indonesian vs Puerto Rican Average Family Size
COMPARE
Indonesian
Puerto Rican
Average Family Size
Average Family Size Comparison
Indonesians
Puerto Ricans
3.28
AVERAGE FAMILY SIZE
96.2/ 100
METRIC RATING
111th/ 347
METRIC RANK
3.28
AVERAGE FAMILY SIZE
96.7/ 100
METRIC RATING
109th/ 347
METRIC RANK
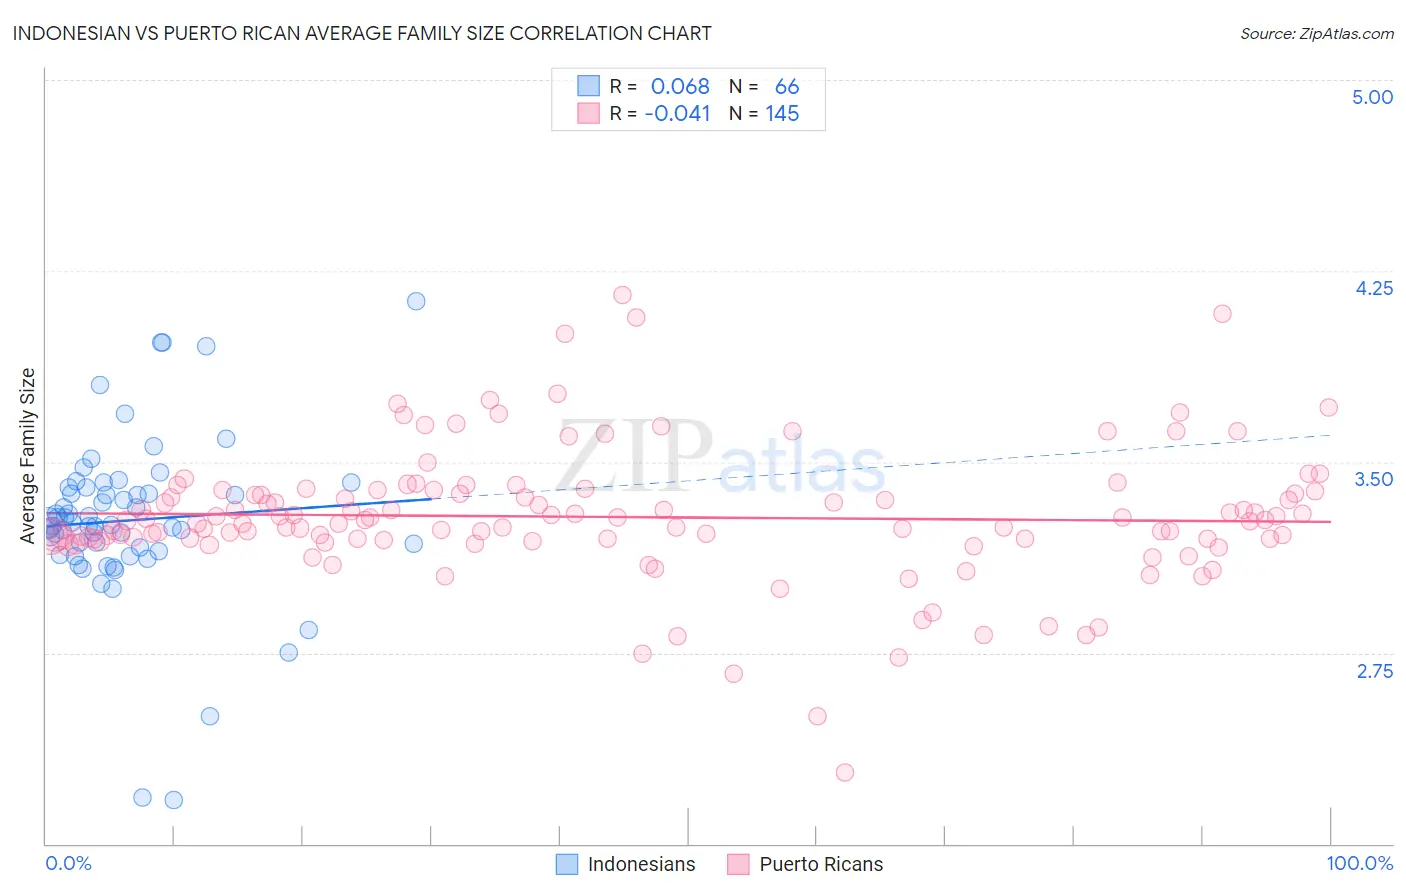
Indonesian vs Puerto Rican Average Family Size Correlation Chart
The statistical analysis conducted on geographies consisting of 162,608,656 people shows a slight positive correlation between the proportion of Indonesians and average family size in the United States with a correlation coefficient (R) of 0.068 and weighted average of 3.28. Similarly, the statistical analysis conducted on geographies consisting of 527,724,175 people shows no correlation between the proportion of Puerto Ricans and average family size in the United States with a correlation coefficient (R) of -0.041 and weighted average of 3.28, a difference of 0.060%.
Average Family Size Correlation Summary
| Measurement | Indonesian | Puerto Rican |
| Minimum | 2.17 | 2.28 |
| Maximum | 4.13 | 4.16 |
| Range | 1.96 | 1.88 |
| Mean | 3.27 | 3.28 |
| Median | 3.25 | 3.27 |
| Interquartile 25% (IQ1) | 3.15 | 3.20 |
| Interquartile 75% (IQ3) | 3.40 | 3.38 |
| Interquartile Range (IQR) | 0.25 | 0.18 |
| Standard Deviation (Sample) | 0.33 | 0.26 |
| Standard Deviation (Population) | 0.33 | 0.26 |
Demographics Similar to Indonesians and Puerto Ricans by Average Family Size
In terms of average family size, the demographic groups most similar to Indonesians are Bahamian (3.28, a difference of 0.050%), Black/African American (3.27, a difference of 0.060%), Immigrants from Panama (3.27, a difference of 0.070%), Asian (3.28, a difference of 0.11%), and South American (3.27, a difference of 0.12%). Similarly, the demographic groups most similar to Puerto Ricans are Bahamian (3.28, a difference of 0.020%), Asian (3.28, a difference of 0.050%), Black/African American (3.27, a difference of 0.13%), Immigrants from Panama (3.27, a difference of 0.14%), and South American (3.27, a difference of 0.18%).
| Demographics | Rating | Rank | Average Family Size |
| Guamanians/Chamorros | 98.6 /100 | #100 | Exceptional 3.29 |
| Immigrants | Burma/Myanmar | 98.6 /100 | #101 | Exceptional 3.29 |
| West Indians | 98.5 /100 | #102 | Exceptional 3.29 |
| Immigrants | Western Africa | 98.4 /100 | #103 | Exceptional 3.29 |
| Bolivians | 98.3 /100 | #104 | Exceptional 3.29 |
| Immigrants | Ghana | 98.1 /100 | #105 | Exceptional 3.29 |
| Paiute | 98.0 /100 | #106 | Exceptional 3.29 |
| Ghanaians | 98.0 /100 | #107 | Exceptional 3.29 |
| Asians | 97.0 /100 | #108 | Exceptional 3.28 |
| Puerto Ricans | 96.7 /100 | #109 | Exceptional 3.28 |
| Bahamians | 96.6 /100 | #110 | Exceptional 3.28 |
| Indonesians | 96.2 /100 | #111 | Exceptional 3.28 |
| Blacks/African Americans | 95.7 /100 | #112 | Exceptional 3.27 |
| Immigrants | Panama | 95.6 /100 | #113 | Exceptional 3.27 |
| South Americans | 95.1 /100 | #114 | Exceptional 3.27 |
| Immigrants | Liberia | 95.0 /100 | #115 | Exceptional 3.27 |
| Immigrants | South America | 95.0 /100 | #116 | Exceptional 3.27 |
| Kiowa | 94.8 /100 | #117 | Exceptional 3.27 |
| Immigrants | Asia | 94.0 /100 | #118 | Exceptional 3.27 |
| Immigrants | Indonesia | 93.7 /100 | #119 | Exceptional 3.27 |
| Immigrants | Bahamas | 93.6 /100 | #120 | Exceptional 3.27 |