Alaskan Athabascan vs Puerto Rican Average Family Size
COMPARE
Alaskan Athabascan
Puerto Rican
Average Family Size
Average Family Size Comparison
Alaskan Athabascans
Puerto Ricans
3.27
AVERAGE FAMILY SIZE
92.4/ 100
METRIC RATING
123rd/ 347
METRIC RANK
3.28
AVERAGE FAMILY SIZE
96.7/ 100
METRIC RATING
109th/ 347
METRIC RANK
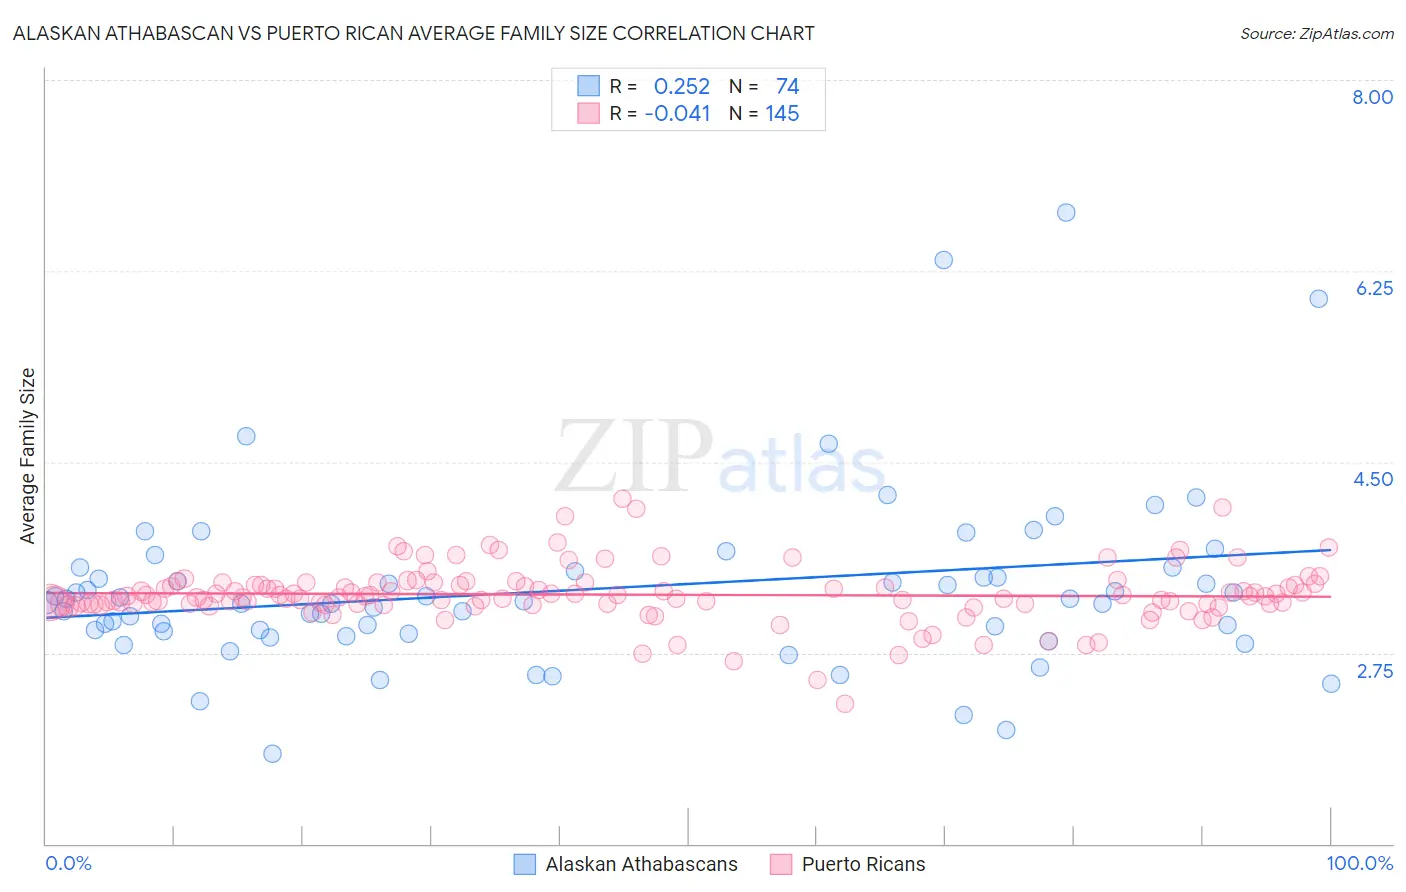
Alaskan Athabascan vs Puerto Rican Average Family Size Correlation Chart
The statistical analysis conducted on geographies consisting of 45,814,644 people shows a weak positive correlation between the proportion of Alaskan Athabascans and average family size in the United States with a correlation coefficient (R) of 0.252 and weighted average of 3.27. Similarly, the statistical analysis conducted on geographies consisting of 527,724,175 people shows no correlation between the proportion of Puerto Ricans and average family size in the United States with a correlation coefficient (R) of -0.041 and weighted average of 3.28, a difference of 0.40%.
Average Family Size Correlation Summary
| Measurement | Alaskan Athabascan | Puerto Rican |
| Minimum | 1.83 | 2.28 |
| Maximum | 6.79 | 4.16 |
| Range | 4.96 | 1.88 |
| Mean | 3.34 | 3.28 |
| Median | 3.21 | 3.27 |
| Interquartile 25% (IQ1) | 2.95 | 3.20 |
| Interquartile 75% (IQ3) | 3.50 | 3.38 |
| Interquartile Range (IQR) | 0.55 | 0.18 |
| Standard Deviation (Sample) | 0.82 | 0.26 |
| Standard Deviation (Population) | 0.82 | 0.26 |
Demographics Similar to Alaskan Athabascans and Puerto Ricans by Average Family Size
In terms of average family size, the demographic groups most similar to Alaskan Athabascans are Immigrants from Colombia (3.27, a difference of 0.020%), South American Indian (3.26, a difference of 0.050%), Immigrants from Thailand (3.27, a difference of 0.060%), Immigrants from Cuba (3.26, a difference of 0.070%), and Immigrants from Bahamas (3.27, a difference of 0.080%). Similarly, the demographic groups most similar to Puerto Ricans are Bahamian (3.28, a difference of 0.020%), Asian (3.28, a difference of 0.050%), Indonesian (3.28, a difference of 0.060%), Black/African American (3.27, a difference of 0.13%), and Immigrants from Panama (3.27, a difference of 0.14%).
| Demographics | Rating | Rank | Average Family Size |
| Paiute | 98.0 /100 | #106 | Exceptional 3.29 |
| Ghanaians | 98.0 /100 | #107 | Exceptional 3.29 |
| Asians | 97.0 /100 | #108 | Exceptional 3.28 |
| Puerto Ricans | 96.7 /100 | #109 | Exceptional 3.28 |
| Bahamians | 96.6 /100 | #110 | Exceptional 3.28 |
| Indonesians | 96.2 /100 | #111 | Exceptional 3.28 |
| Blacks/African Americans | 95.7 /100 | #112 | Exceptional 3.27 |
| Immigrants | Panama | 95.6 /100 | #113 | Exceptional 3.27 |
| South Americans | 95.1 /100 | #114 | Exceptional 3.27 |
| Immigrants | Liberia | 95.0 /100 | #115 | Exceptional 3.27 |
| Immigrants | South America | 95.0 /100 | #116 | Exceptional 3.27 |
| Kiowa | 94.8 /100 | #117 | Exceptional 3.27 |
| Immigrants | Asia | 94.0 /100 | #118 | Exceptional 3.27 |
| Immigrants | Indonesia | 93.7 /100 | #119 | Exceptional 3.27 |
| Immigrants | Bahamas | 93.6 /100 | #120 | Exceptional 3.27 |
| Immigrants | Thailand | 93.3 /100 | #121 | Exceptional 3.27 |
| Immigrants | Colombia | 92.8 /100 | #122 | Exceptional 3.27 |
| Alaskan Athabascans | 92.4 /100 | #123 | Exceptional 3.27 |
| South American Indians | 91.6 /100 | #124 | Exceptional 3.26 |
| Immigrants | Cuba | 91.3 /100 | #125 | Exceptional 3.26 |
| Immigrants | Costa Rica | 90.7 /100 | #126 | Exceptional 3.26 |