Moroccan vs Puerto Rican Average Family Size
COMPARE
Moroccan
Puerto Rican
Average Family Size
Average Family Size Comparison
Moroccans
Puerto Ricans
3.22
AVERAGE FAMILY SIZE
44.2/ 100
METRIC RATING
182nd/ 347
METRIC RANK
3.28
AVERAGE FAMILY SIZE
96.7/ 100
METRIC RATING
109th/ 347
METRIC RANK
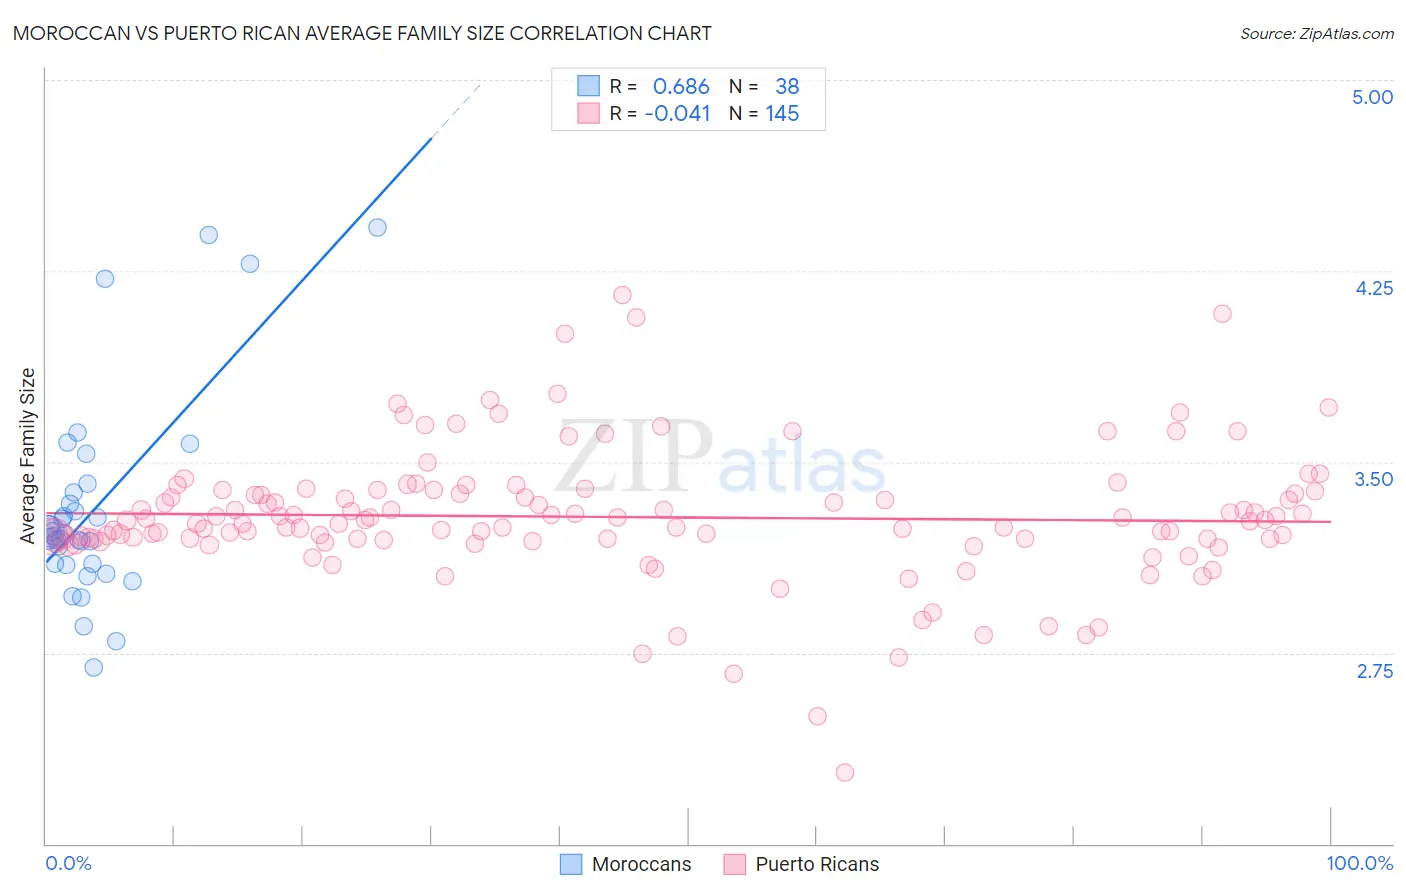
Moroccan vs Puerto Rican Average Family Size Correlation Chart
The statistical analysis conducted on geographies consisting of 201,760,507 people shows a significant positive correlation between the proportion of Moroccans and average family size in the United States with a correlation coefficient (R) of 0.686 and weighted average of 3.22. Similarly, the statistical analysis conducted on geographies consisting of 527,724,175 people shows no correlation between the proportion of Puerto Ricans and average family size in the United States with a correlation coefficient (R) of -0.041 and weighted average of 3.28, a difference of 1.7%.
Average Family Size Correlation Summary
| Measurement | Moroccan | Puerto Rican |
| Minimum | 2.69 | 2.28 |
| Maximum | 4.42 | 4.16 |
| Range | 1.73 | 1.88 |
| Mean | 3.32 | 3.28 |
| Median | 3.21 | 3.27 |
| Interquartile 25% (IQ1) | 3.10 | 3.20 |
| Interquartile 75% (IQ3) | 3.38 | 3.38 |
| Interquartile Range (IQR) | 0.28 | 0.18 |
| Standard Deviation (Sample) | 0.40 | 0.26 |
| Standard Deviation (Population) | 0.40 | 0.26 |
Similar Demographics by Average Family Size
Demographics Similar to Moroccans by Average Family Size
In terms of average family size, the demographic groups most similar to Moroccans are Spanish (3.23, a difference of 0.010%), Palestinian (3.23, a difference of 0.040%), Spaniard (3.23, a difference of 0.050%), Immigrants from Korea (3.23, a difference of 0.050%), and Immigrants from Northern Africa (3.22, a difference of 0.050%).
| Demographics | Rating | Rank | Average Family Size |
| Immigrants | China | 49.9 /100 | #175 | Average 3.23 |
| Israelis | 48.7 /100 | #176 | Average 3.23 |
| Argentineans | 47.4 /100 | #177 | Average 3.23 |
| Spaniards | 47.2 /100 | #178 | Average 3.23 |
| Immigrants | Korea | 46.9 /100 | #179 | Average 3.23 |
| Palestinians | 46.6 /100 | #180 | Average 3.23 |
| Spanish | 44.8 /100 | #181 | Average 3.23 |
| Moroccans | 44.2 /100 | #182 | Average 3.22 |
| Immigrants | Northern Africa | 41.7 /100 | #183 | Average 3.22 |
| Immigrants | Eastern Asia | 40.8 /100 | #184 | Average 3.22 |
| Immigrants | Sri Lanka | 39.8 /100 | #185 | Fair 3.22 |
| Immigrants | Argentina | 39.8 /100 | #186 | Fair 3.22 |
| Immigrants | Malaysia | 39.0 /100 | #187 | Fair 3.22 |
| Thais | 38.3 /100 | #188 | Fair 3.22 |
| Pakistanis | 33.7 /100 | #189 | Fair 3.22 |
Demographics Similar to Puerto Ricans by Average Family Size
In terms of average family size, the demographic groups most similar to Puerto Ricans are Bahamian (3.28, a difference of 0.020%), Asian (3.28, a difference of 0.050%), Indonesian (3.28, a difference of 0.060%), Black/African American (3.27, a difference of 0.13%), and Immigrants from Panama (3.27, a difference of 0.14%).
| Demographics | Rating | Rank | Average Family Size |
| West Indians | 98.5 /100 | #102 | Exceptional 3.29 |
| Immigrants | Western Africa | 98.4 /100 | #103 | Exceptional 3.29 |
| Bolivians | 98.3 /100 | #104 | Exceptional 3.29 |
| Immigrants | Ghana | 98.1 /100 | #105 | Exceptional 3.29 |
| Paiute | 98.0 /100 | #106 | Exceptional 3.29 |
| Ghanaians | 98.0 /100 | #107 | Exceptional 3.29 |
| Asians | 97.0 /100 | #108 | Exceptional 3.28 |
| Puerto Ricans | 96.7 /100 | #109 | Exceptional 3.28 |
| Bahamians | 96.6 /100 | #110 | Exceptional 3.28 |
| Indonesians | 96.2 /100 | #111 | Exceptional 3.28 |
| Blacks/African Americans | 95.7 /100 | #112 | Exceptional 3.27 |
| Immigrants | Panama | 95.6 /100 | #113 | Exceptional 3.27 |
| South Americans | 95.1 /100 | #114 | Exceptional 3.27 |
| Immigrants | Liberia | 95.0 /100 | #115 | Exceptional 3.27 |
| Immigrants | South America | 95.0 /100 | #116 | Exceptional 3.27 |