Menominee vs Puerto Rican 5th Grade
COMPARE
Menominee
Puerto Rican
5th Grade
5th Grade Comparison
Menominee
Puerto Ricans
97.7%
5TH GRADE
96.3/ 100
METRIC RATING
111th/ 347
METRIC RANK
96.1%
5TH GRADE
0.0/ 100
METRIC RATING
303rd/ 347
METRIC RANK
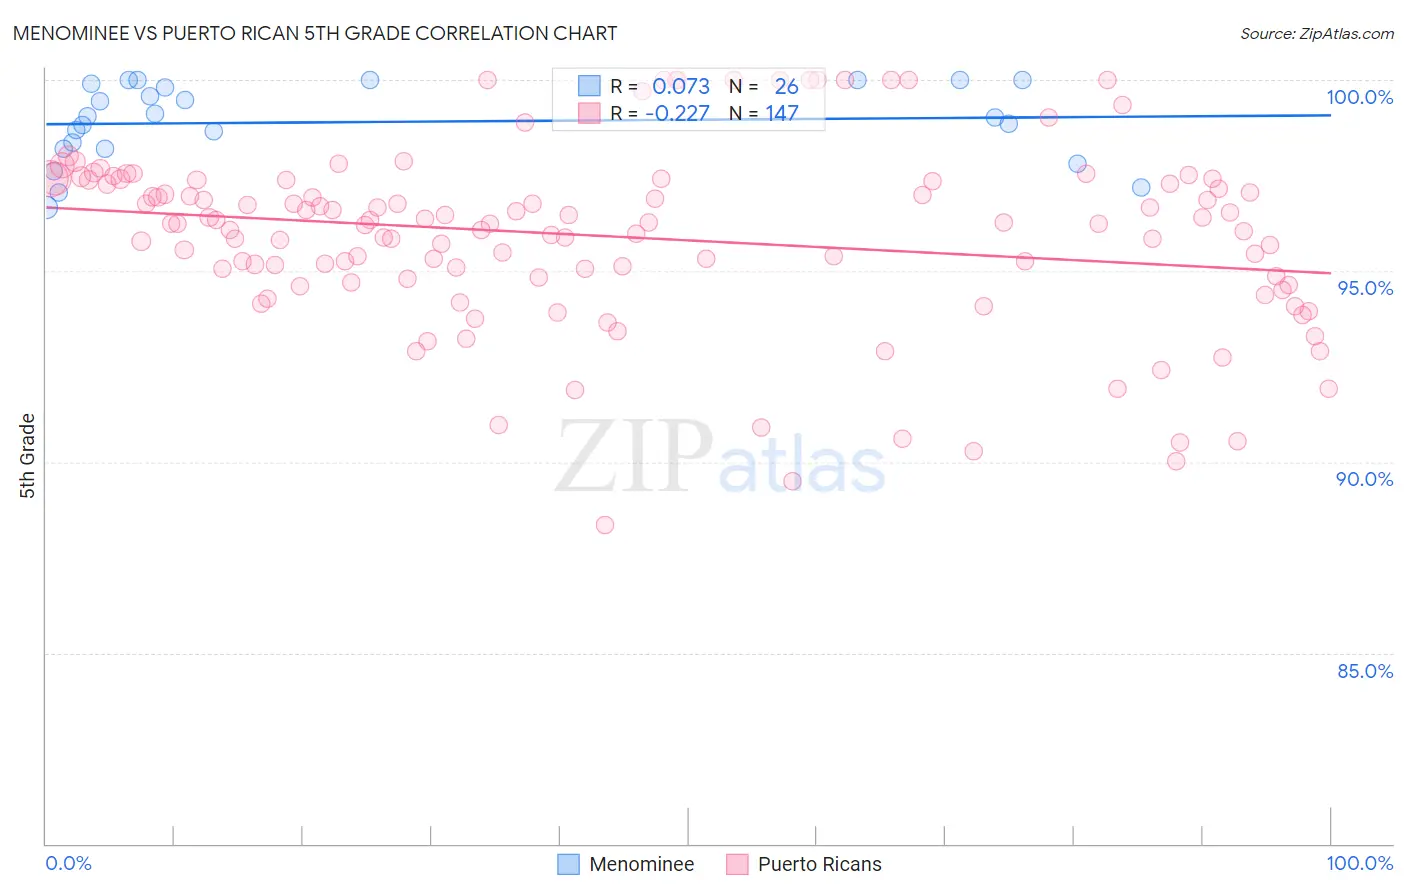
Menominee vs Puerto Rican 5th Grade Correlation Chart
The statistical analysis conducted on geographies consisting of 45,778,979 people shows a slight positive correlation between the proportion of Menominee and percentage of population with at least 5th grade education in the United States with a correlation coefficient (R) of 0.073 and weighted average of 97.7%. Similarly, the statistical analysis conducted on geographies consisting of 528,320,438 people shows a weak negative correlation between the proportion of Puerto Ricans and percentage of population with at least 5th grade education in the United States with a correlation coefficient (R) of -0.227 and weighted average of 96.1%, a difference of 1.6%.
5th Grade Correlation Summary
| Measurement | Menominee | Puerto Rican |
| Minimum | 96.6% | 88.4% |
| Maximum | 100.0% | 100.0% |
| Range | 3.4% | 11.6% |
| Mean | 98.9% | 95.9% |
| Median | 99.0% | 96.2% |
| Interquartile 25% (IQ1) | 98.2% | 94.8% |
| Interquartile 75% (IQ3) | 99.9% | 97.4% |
| Interquartile Range (IQR) | 1.7% | 2.6% |
| Standard Deviation (Sample) | 1.0% | 2.4% |
| Standard Deviation (Population) | 1.00% | 2.4% |
Similar Demographics by 5th Grade
Demographics Similar to Menominee by 5th Grade
In terms of 5th grade, the demographic groups most similar to Menominee are Immigrants from Switzerland (97.7%, a difference of 0.010%), Iroquois (97.7%, a difference of 0.010%), Immigrants from Latvia (97.7%, a difference of 0.020%), Thai (97.7%, a difference of 0.020%), and Lebanese (97.6%, a difference of 0.020%).
| Demographics | Rating | Rank | 5th Grade |
| German Russians | 97.8 /100 | #104 | Exceptional 97.7% |
| Bhutanese | 97.6 /100 | #105 | Exceptional 97.7% |
| Immigrants | Czechoslovakia | 97.5 /100 | #106 | Exceptional 97.7% |
| Immigrants | Singapore | 97.5 /100 | #107 | Exceptional 97.7% |
| Immigrants | Nonimmigrants | 97.3 /100 | #108 | Exceptional 97.7% |
| Immigrants | Latvia | 97.1 /100 | #109 | Exceptional 97.7% |
| Thais | 96.9 /100 | #110 | Exceptional 97.7% |
| Menominee | 96.3 /100 | #111 | Exceptional 97.7% |
| Immigrants | Switzerland | 96.0 /100 | #112 | Exceptional 97.7% |
| Iroquois | 95.9 /100 | #113 | Exceptional 97.7% |
| Lebanese | 95.7 /100 | #114 | Exceptional 97.6% |
| Okinawans | 95.7 /100 | #115 | Exceptional 97.6% |
| Immigrants | Croatia | 95.5 /100 | #116 | Exceptional 97.6% |
| Immigrants | Saudi Arabia | 95.4 /100 | #117 | Exceptional 97.6% |
| Basques | 95.2 /100 | #118 | Exceptional 97.6% |
Demographics Similar to Puerto Ricans by 5th Grade
In terms of 5th grade, the demographic groups most similar to Puerto Ricans are Guyanese (96.1%, a difference of 0.010%), Immigrants from Cuba (96.1%, a difference of 0.020%), Immigrants from Burma/Myanmar (96.1%, a difference of 0.030%), Sri Lankan (96.1%, a difference of 0.040%), and Immigrants from Laos (96.0%, a difference of 0.040%).
| Demographics | Rating | Rank | 5th Grade |
| Immigrants | South Eastern Asia | 0.0 /100 | #296 | Tragic 96.3% |
| Haitians | 0.0 /100 | #297 | Tragic 96.3% |
| Immigrants | Dominica | 0.0 /100 | #298 | Tragic 96.2% |
| Immigrants | Immigrants | 0.0 /100 | #299 | Tragic 96.2% |
| Sri Lankans | 0.0 /100 | #300 | Tragic 96.1% |
| Immigrants | Cuba | 0.0 /100 | #301 | Tragic 96.1% |
| Guyanese | 0.0 /100 | #302 | Tragic 96.1% |
| Puerto Ricans | 0.0 /100 | #303 | Tragic 96.1% |
| Immigrants | Burma/Myanmar | 0.0 /100 | #304 | Tragic 96.1% |
| Immigrants | Laos | 0.0 /100 | #305 | Tragic 96.0% |
| Immigrants | Haiti | 0.0 /100 | #306 | Tragic 96.0% |
| Immigrants | Caribbean | 0.0 /100 | #307 | Tragic 96.0% |
| Ecuadorians | 0.0 /100 | #308 | Tragic 96.0% |
| Immigrants | Guyana | 0.0 /100 | #309 | Tragic 96.0% |
| Indonesians | 0.0 /100 | #310 | Tragic 96.0% |