Serbian vs Danish Family Households
COMPARE
Serbian
Danish
Family Households
Family Households Comparison
Serbians
Danes
63.0%
FAMILY HOUSEHOLDS
0.3/ 100
METRIC RATING
276th/ 347
METRIC RANK
66.0%
FAMILY HOUSEHOLDS
100.0/ 100
METRIC RATING
61st/ 347
METRIC RANK
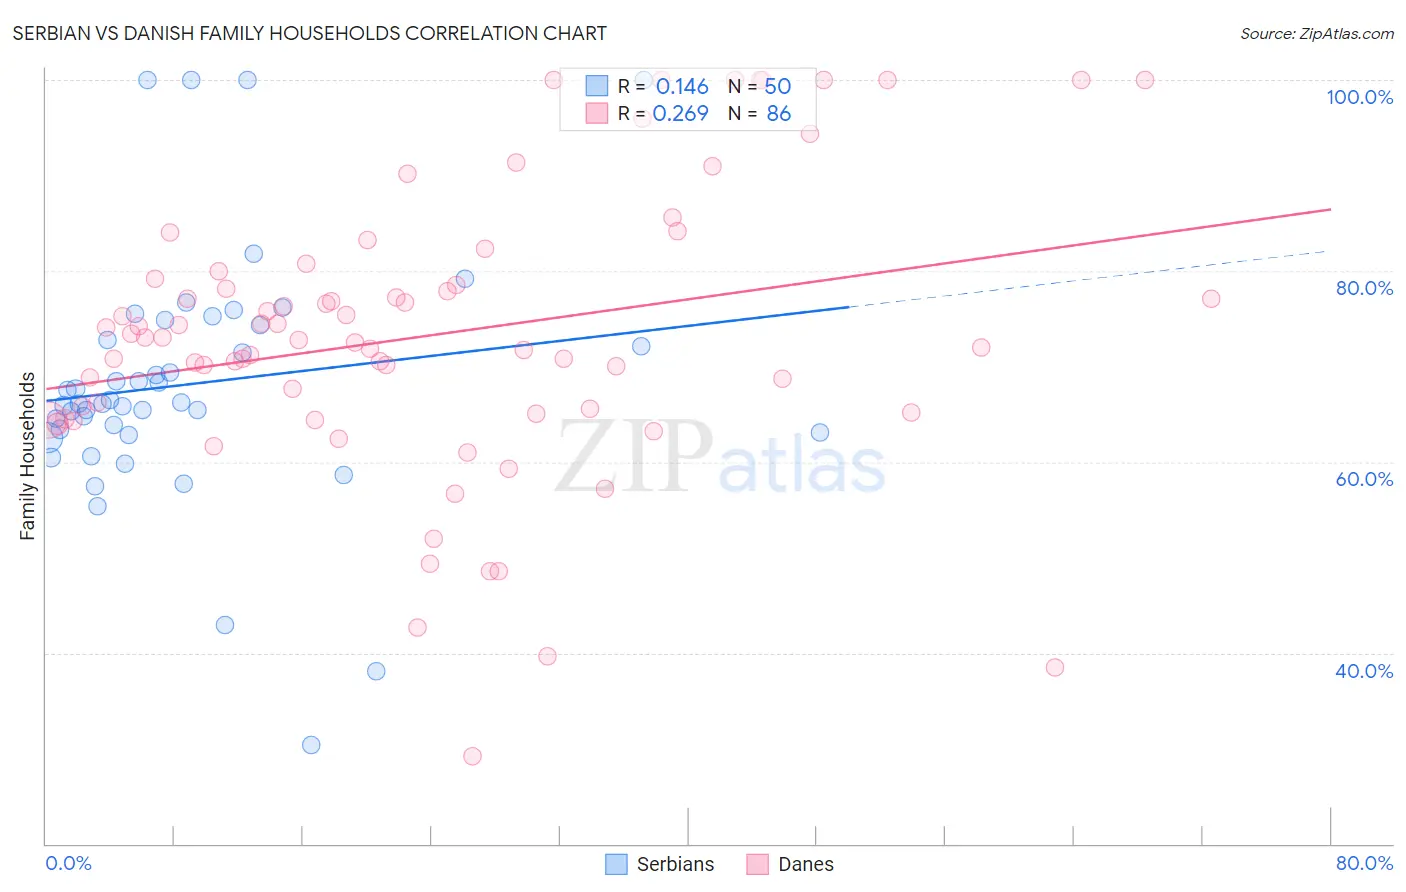
Serbian vs Danish Family Households Correlation Chart
The statistical analysis conducted on geographies consisting of 267,533,115 people shows a poor positive correlation between the proportion of Serbians and percentage of family households in the United States with a correlation coefficient (R) of 0.146 and weighted average of 63.0%. Similarly, the statistical analysis conducted on geographies consisting of 473,910,388 people shows a weak positive correlation between the proportion of Danes and percentage of family households in the United States with a correlation coefficient (R) of 0.269 and weighted average of 66.0%, a difference of 4.7%.
Family Households Correlation Summary
| Measurement | Serbian | Danish |
| Minimum | 30.3% | 29.2% |
| Maximum | 100.0% | 100.0% |
| Range | 69.7% | 70.8% |
| Mean | 68.2% | 73.3% |
| Median | 66.2% | 72.9% |
| Interquartile 25% (IQ1) | 63.0% | 65.2% |
| Interquartile 75% (IQ3) | 74.4% | 79.2% |
| Interquartile Range (IQR) | 11.3% | 14.0% |
| Standard Deviation (Sample) | 13.3% | 14.9% |
| Standard Deviation (Population) | 13.2% | 14.8% |
Similar Demographics by Family Households
Demographics Similar to Serbians by Family Households
In terms of family households, the demographic groups most similar to Serbians are Lumbee (63.1%, a difference of 0.010%), West Indian (63.1%, a difference of 0.010%), Immigrants from Kazakhstan (63.1%, a difference of 0.020%), Immigrants from Croatia (63.1%, a difference of 0.030%), and Immigrants from Turkey (63.1%, a difference of 0.030%).
| Demographics | Rating | Rank | Family Households |
| Yugoslavians | 0.4 /100 | #269 | Tragic 63.1% |
| Immigrants | Austria | 0.3 /100 | #270 | Tragic 63.1% |
| Immigrants | Croatia | 0.3 /100 | #271 | Tragic 63.1% |
| Immigrants | Turkey | 0.3 /100 | #272 | Tragic 63.1% |
| Immigrants | Kazakhstan | 0.3 /100 | #273 | Tragic 63.1% |
| Lumbee | 0.3 /100 | #274 | Tragic 63.1% |
| West Indians | 0.3 /100 | #275 | Tragic 63.1% |
| Serbians | 0.3 /100 | #276 | Tragic 63.0% |
| Ottawa | 0.3 /100 | #277 | Tragic 63.0% |
| Immigrants | Belgium | 0.2 /100 | #278 | Tragic 63.0% |
| Immigrants | Yemen | 0.2 /100 | #279 | Tragic 63.0% |
| Immigrants | Bulgaria | 0.2 /100 | #280 | Tragic 63.0% |
| Estonians | 0.2 /100 | #281 | Tragic 62.9% |
| New Zealanders | 0.1 /100 | #282 | Tragic 62.9% |
| Immigrants | Denmark | 0.1 /100 | #283 | Tragic 62.9% |
Demographics Similar to Danes by Family Households
In terms of family households, the demographic groups most similar to Danes are South American (66.0%, a difference of 0.020%), Immigrants from Korea (66.0%, a difference of 0.030%), Central American (66.0%, a difference of 0.030%), Immigrants from Asia (66.1%, a difference of 0.050%), and Immigrants from Indonesia (66.0%, a difference of 0.070%).
| Demographics | Rating | Rank | Family Households |
| Immigrants | Colombia | 100.0 /100 | #54 | Exceptional 66.3% |
| Immigrants | Immigrants | 100.0 /100 | #55 | Exceptional 66.1% |
| Immigrants | Hong Kong | 100.0 /100 | #56 | Exceptional 66.1% |
| Pennsylvania Germans | 100.0 /100 | #57 | Exceptional 66.1% |
| Immigrants | Asia | 100.0 /100 | #58 | Exceptional 66.1% |
| Immigrants | Korea | 100.0 /100 | #59 | Exceptional 66.0% |
| South Americans | 100.0 /100 | #60 | Exceptional 66.0% |
| Danes | 100.0 /100 | #61 | Exceptional 66.0% |
| Central Americans | 100.0 /100 | #62 | Exceptional 66.0% |
| Immigrants | Indonesia | 100.0 /100 | #63 | Exceptional 66.0% |
| Pima | 99.9 /100 | #64 | Exceptional 65.9% |
| Costa Ricans | 99.9 /100 | #65 | Exceptional 65.9% |
| Fijians | 99.9 /100 | #66 | Exceptional 65.9% |
| Filipinos | 99.9 /100 | #67 | Exceptional 65.9% |
| Japanese | 99.9 /100 | #68 | Exceptional 65.9% |