Immigrants from Panama vs Danish Family Households
COMPARE
Immigrants from Panama
Danish
Family Households
Family Households Comparison
Immigrants from Panama
Danes
64.8%
FAMILY HOUSEHOLDS
92.0/ 100
METRIC RATING
127th/ 347
METRIC RANK
66.0%
FAMILY HOUSEHOLDS
100.0/ 100
METRIC RATING
61st/ 347
METRIC RANK
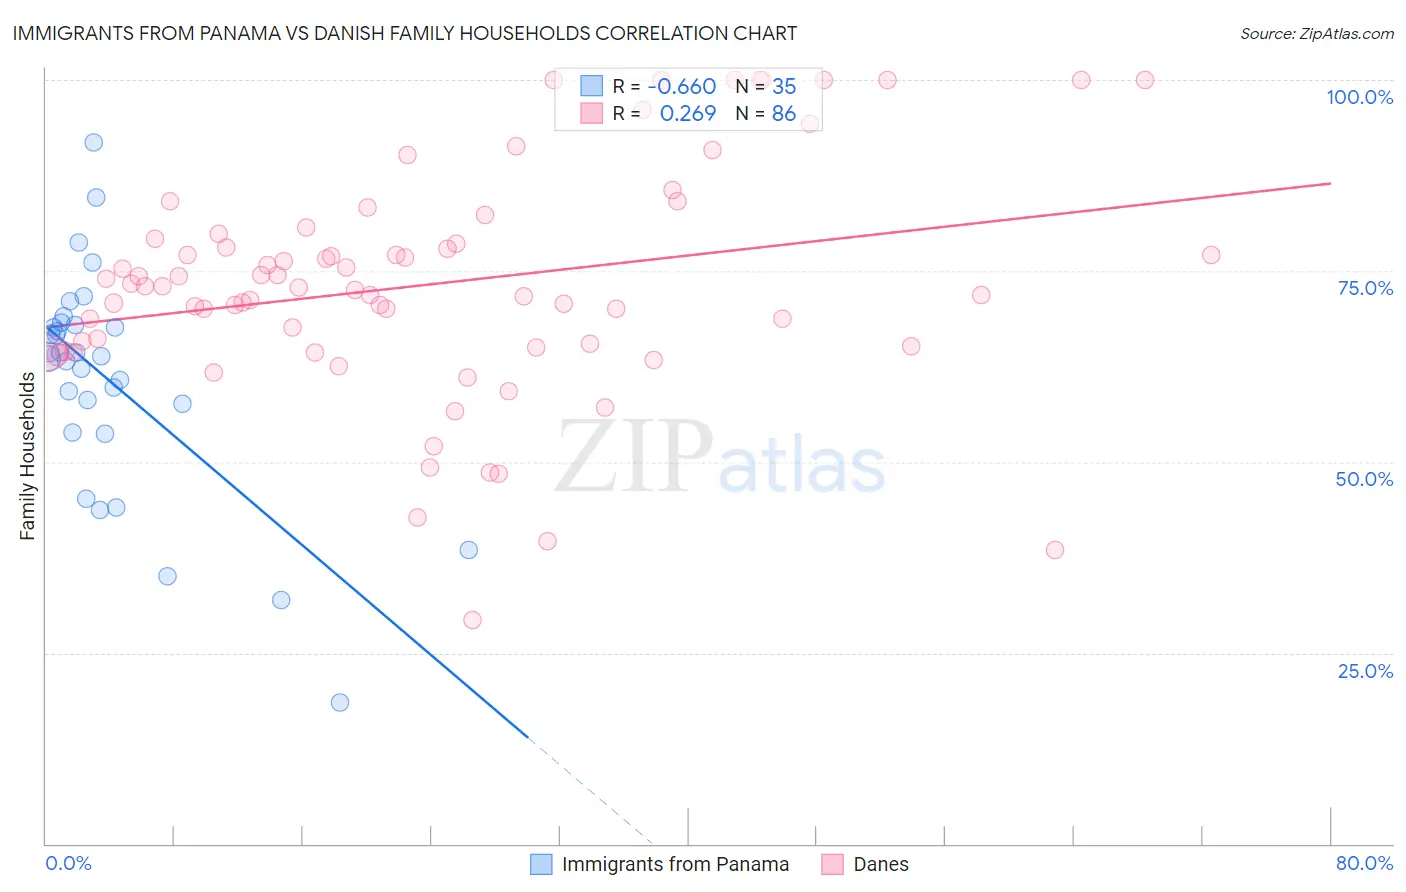
Immigrants from Panama vs Danish Family Households Correlation Chart
The statistical analysis conducted on geographies consisting of 221,156,465 people shows a significant negative correlation between the proportion of Immigrants from Panama and percentage of family households in the United States with a correlation coefficient (R) of -0.660 and weighted average of 64.8%. Similarly, the statistical analysis conducted on geographies consisting of 473,910,388 people shows a weak positive correlation between the proportion of Danes and percentage of family households in the United States with a correlation coefficient (R) of 0.269 and weighted average of 66.0%, a difference of 1.8%.
Family Households Correlation Summary
| Measurement | Immigrants from Panama | Danish |
| Minimum | 18.6% | 29.2% |
| Maximum | 91.8% | 100.0% |
| Range | 73.2% | 70.8% |
| Mean | 60.6% | 73.3% |
| Median | 63.8% | 72.9% |
| Interquartile 25% (IQ1) | 53.8% | 65.2% |
| Interquartile 75% (IQ3) | 68.0% | 79.2% |
| Interquartile Range (IQR) | 14.2% | 14.0% |
| Standard Deviation (Sample) | 14.8% | 14.9% |
| Standard Deviation (Population) | 14.6% | 14.8% |
Similar Demographics by Family Households
Demographics Similar to Immigrants from Panama by Family Households
In terms of family households, the demographic groups most similar to Immigrants from Panama are Italian (64.8%, a difference of 0.010%), Panamanian (64.8%, a difference of 0.020%), Immigrants from Belize (64.9%, a difference of 0.030%), Immigrants from Ecuador (64.8%, a difference of 0.030%), and Immigrants from Argentina (64.9%, a difference of 0.040%).
| Demographics | Rating | Rank | Family Households |
| Immigrants | Oceania | 94.2 /100 | #120 | Exceptional 64.9% |
| Hungarians | 94.0 /100 | #121 | Exceptional 64.9% |
| Hmong | 93.4 /100 | #122 | Exceptional 64.9% |
| Choctaw | 93.4 /100 | #123 | Exceptional 64.9% |
| Immigrants | Argentina | 92.8 /100 | #124 | Exceptional 64.9% |
| Immigrants | Belize | 92.7 /100 | #125 | Exceptional 64.9% |
| Panamanians | 92.4 /100 | #126 | Exceptional 64.8% |
| Immigrants | Panama | 92.0 /100 | #127 | Exceptional 64.8% |
| Italians | 91.9 /100 | #128 | Exceptional 64.8% |
| Immigrants | Ecuador | 91.4 /100 | #129 | Exceptional 64.8% |
| Immigrants | Italy | 90.2 /100 | #130 | Exceptional 64.8% |
| Immigrants | Nonimmigrants | 90.1 /100 | #131 | Exceptional 64.8% |
| Cajuns | 89.4 /100 | #132 | Excellent 64.8% |
| Belizeans | 89.3 /100 | #133 | Excellent 64.8% |
| Greeks | 88.1 /100 | #134 | Excellent 64.7% |
Demographics Similar to Danes by Family Households
In terms of family households, the demographic groups most similar to Danes are South American (66.0%, a difference of 0.020%), Immigrants from Korea (66.0%, a difference of 0.030%), Central American (66.0%, a difference of 0.030%), Immigrants from Asia (66.1%, a difference of 0.050%), and Immigrants from Indonesia (66.0%, a difference of 0.070%).
| Demographics | Rating | Rank | Family Households |
| Immigrants | Colombia | 100.0 /100 | #54 | Exceptional 66.3% |
| Immigrants | Immigrants | 100.0 /100 | #55 | Exceptional 66.1% |
| Immigrants | Hong Kong | 100.0 /100 | #56 | Exceptional 66.1% |
| Pennsylvania Germans | 100.0 /100 | #57 | Exceptional 66.1% |
| Immigrants | Asia | 100.0 /100 | #58 | Exceptional 66.1% |
| Immigrants | Korea | 100.0 /100 | #59 | Exceptional 66.0% |
| South Americans | 100.0 /100 | #60 | Exceptional 66.0% |
| Danes | 100.0 /100 | #61 | Exceptional 66.0% |
| Central Americans | 100.0 /100 | #62 | Exceptional 66.0% |
| Immigrants | Indonesia | 100.0 /100 | #63 | Exceptional 66.0% |
| Pima | 99.9 /100 | #64 | Exceptional 65.9% |
| Costa Ricans | 99.9 /100 | #65 | Exceptional 65.9% |
| Fijians | 99.9 /100 | #66 | Exceptional 65.9% |
| Filipinos | 99.9 /100 | #67 | Exceptional 65.9% |
| Japanese | 99.9 /100 | #68 | Exceptional 65.9% |