Immigrants from Australia vs Danish Family Households
COMPARE
Immigrants from Australia
Danish
Family Households
Family Households Comparison
Immigrants from Australia
Danes
61.3%
FAMILY HOUSEHOLDS
0.0/ 100
METRIC RATING
330th/ 347
METRIC RANK
66.0%
FAMILY HOUSEHOLDS
100.0/ 100
METRIC RATING
61st/ 347
METRIC RANK
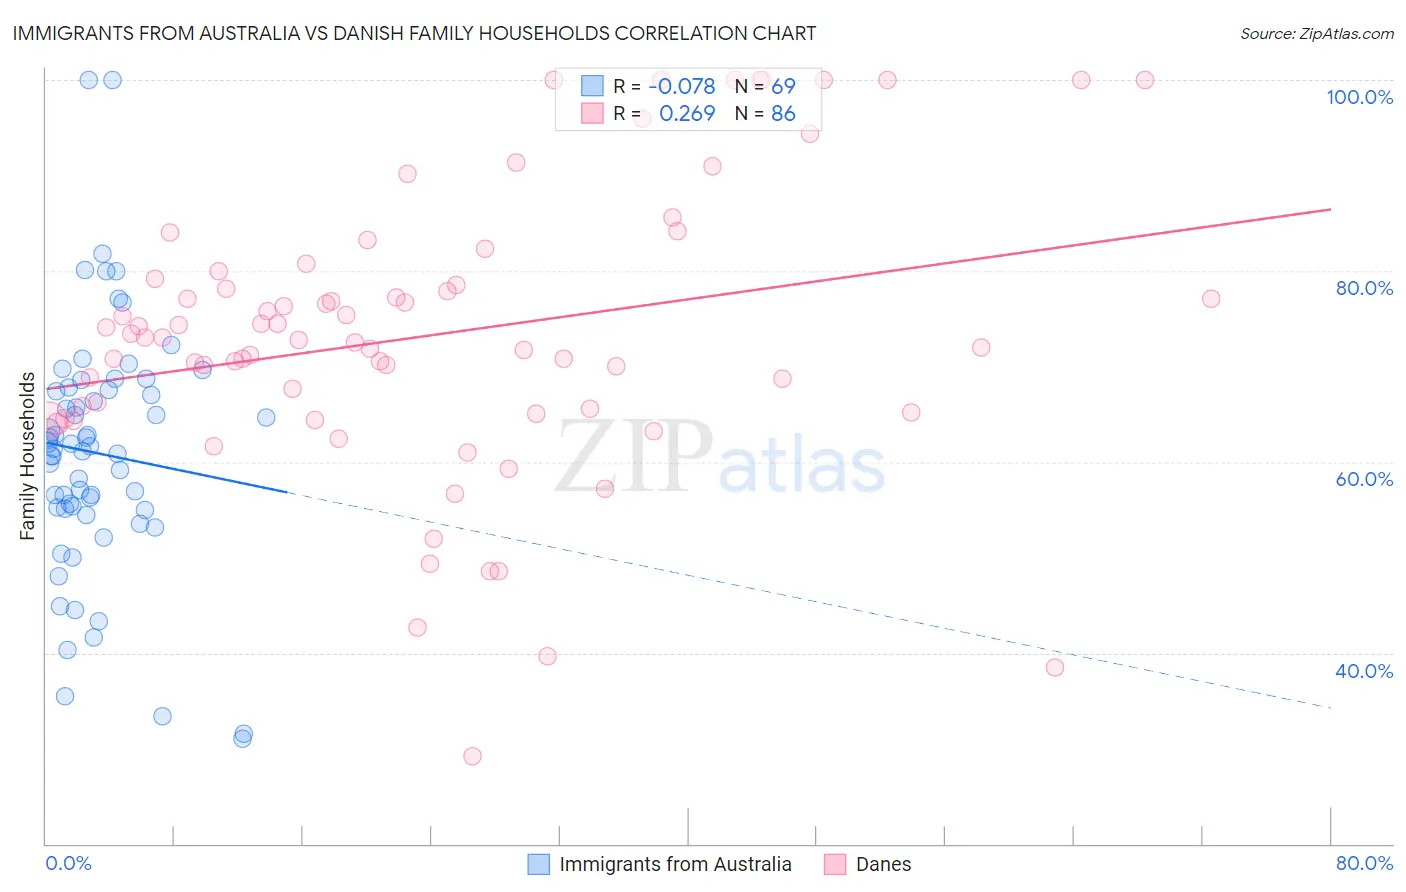
Immigrants from Australia vs Danish Family Households Correlation Chart
The statistical analysis conducted on geographies consisting of 227,146,773 people shows a slight negative correlation between the proportion of Immigrants from Australia and percentage of family households in the United States with a correlation coefficient (R) of -0.078 and weighted average of 61.3%. Similarly, the statistical analysis conducted on geographies consisting of 473,910,388 people shows a weak positive correlation between the proportion of Danes and percentage of family households in the United States with a correlation coefficient (R) of 0.269 and weighted average of 66.0%, a difference of 7.7%.
Family Households Correlation Summary
| Measurement | Immigrants from Australia | Danish |
| Minimum | 31.0% | 29.2% |
| Maximum | 100.0% | 100.0% |
| Range | 69.0% | 70.8% |
| Mean | 60.9% | 73.3% |
| Median | 61.3% | 72.9% |
| Interquartile 25% (IQ1) | 55.1% | 65.2% |
| Interquartile 75% (IQ3) | 67.6% | 79.2% |
| Interquartile Range (IQR) | 12.6% | 14.0% |
| Standard Deviation (Sample) | 13.1% | 14.9% |
| Standard Deviation (Population) | 13.1% | 14.8% |
Similar Demographics by Family Households
Demographics Similar to Immigrants from Australia by Family Households
In terms of family households, the demographic groups most similar to Immigrants from Australia are Immigrants from France (61.3%, a difference of 0.0%), Ethiopian (61.2%, a difference of 0.080%), Cambodian (61.4%, a difference of 0.14%), Kiowa (61.4%, a difference of 0.16%), and Immigrants from Ethiopia (61.2%, a difference of 0.16%).
| Demographics | Rating | Rank | Family Households |
| Tlingit-Haida | 0.0 /100 | #323 | Tragic 61.6% |
| Immigrants | West Indies | 0.0 /100 | #324 | Tragic 61.6% |
| Immigrants | Switzerland | 0.0 /100 | #325 | Tragic 61.6% |
| Indonesians | 0.0 /100 | #326 | Tragic 61.5% |
| Blacks/African Americans | 0.0 /100 | #327 | Tragic 61.5% |
| Kiowa | 0.0 /100 | #328 | Tragic 61.4% |
| Cambodians | 0.0 /100 | #329 | Tragic 61.4% |
| Immigrants | Australia | 0.0 /100 | #330 | Tragic 61.3% |
| Immigrants | France | 0.0 /100 | #331 | Tragic 61.3% |
| Ethiopians | 0.0 /100 | #332 | Tragic 61.2% |
| Immigrants | Ethiopia | 0.0 /100 | #333 | Tragic 61.2% |
| Immigrants | Eastern Africa | 0.0 /100 | #334 | Tragic 61.1% |
| Carpatho Rusyns | 0.0 /100 | #335 | Tragic 61.1% |
| German Russians | 0.0 /100 | #336 | Tragic 60.9% |
| Soviet Union | 0.0 /100 | #337 | Tragic 60.9% |
Demographics Similar to Danes by Family Households
In terms of family households, the demographic groups most similar to Danes are South American (66.0%, a difference of 0.020%), Immigrants from Korea (66.0%, a difference of 0.030%), Central American (66.0%, a difference of 0.030%), Immigrants from Asia (66.1%, a difference of 0.050%), and Immigrants from Indonesia (66.0%, a difference of 0.070%).
| Demographics | Rating | Rank | Family Households |
| Immigrants | Colombia | 100.0 /100 | #54 | Exceptional 66.3% |
| Immigrants | Immigrants | 100.0 /100 | #55 | Exceptional 66.1% |
| Immigrants | Hong Kong | 100.0 /100 | #56 | Exceptional 66.1% |
| Pennsylvania Germans | 100.0 /100 | #57 | Exceptional 66.1% |
| Immigrants | Asia | 100.0 /100 | #58 | Exceptional 66.1% |
| Immigrants | Korea | 100.0 /100 | #59 | Exceptional 66.0% |
| South Americans | 100.0 /100 | #60 | Exceptional 66.0% |
| Danes | 100.0 /100 | #61 | Exceptional 66.0% |
| Central Americans | 100.0 /100 | #62 | Exceptional 66.0% |
| Immigrants | Indonesia | 100.0 /100 | #63 | Exceptional 66.0% |
| Pima | 99.9 /100 | #64 | Exceptional 65.9% |
| Costa Ricans | 99.9 /100 | #65 | Exceptional 65.9% |
| Fijians | 99.9 /100 | #66 | Exceptional 65.9% |
| Filipinos | 99.9 /100 | #67 | Exceptional 65.9% |
| Japanese | 99.9 /100 | #68 | Exceptional 65.9% |