Immigrants from Canada vs Danish Family Households
COMPARE
Immigrants from Canada
Danish
Family Households
Family Households Comparison
Immigrants from Canada
Danes
64.0%
FAMILY HOUSEHOLDS
19.2/ 100
METRIC RATING
196th/ 347
METRIC RANK
66.0%
FAMILY HOUSEHOLDS
100.0/ 100
METRIC RATING
61st/ 347
METRIC RANK
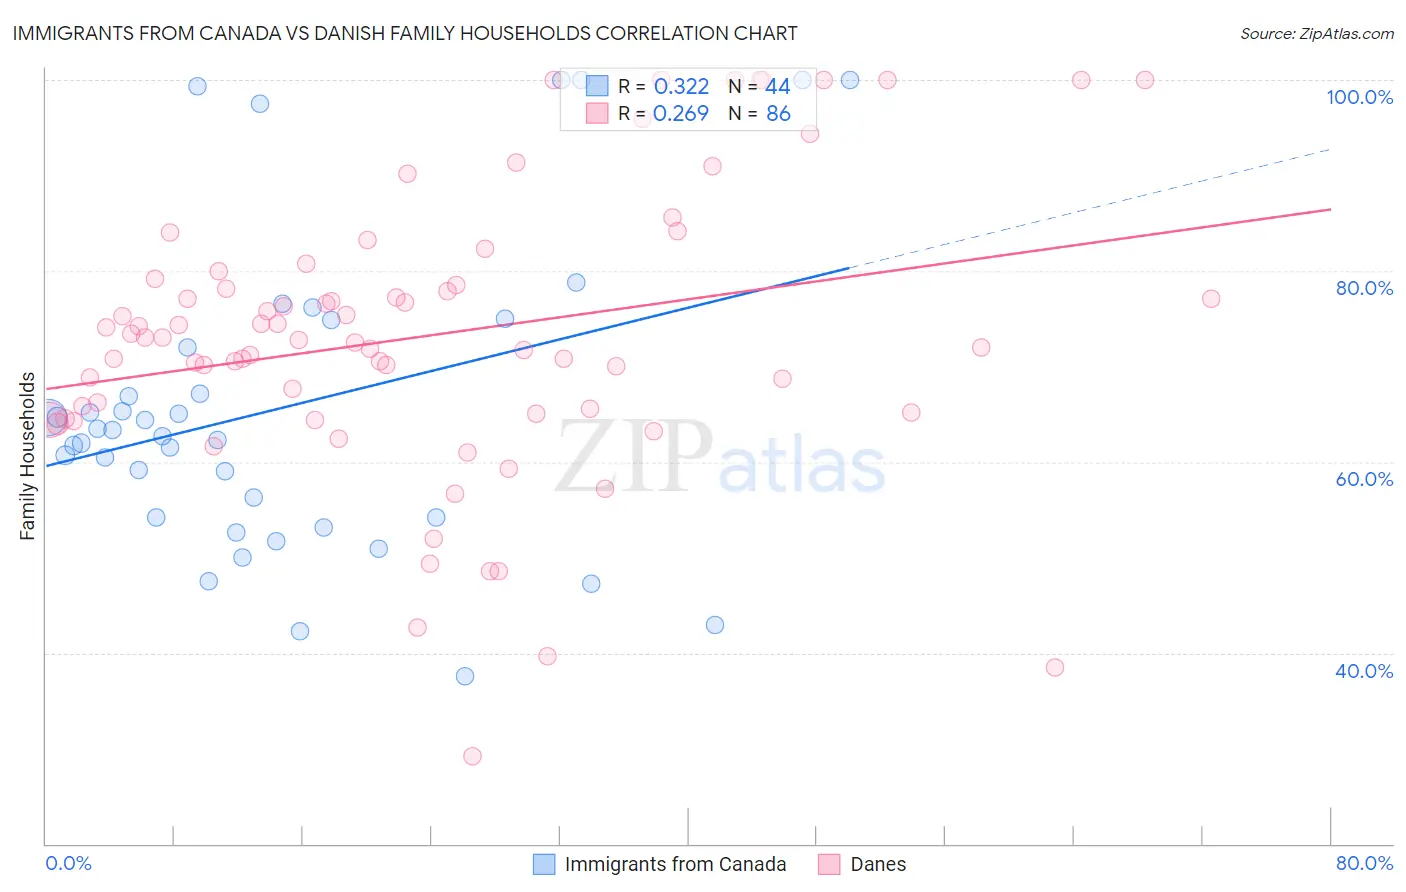
Immigrants from Canada vs Danish Family Households Correlation Chart
The statistical analysis conducted on geographies consisting of 459,128,452 people shows a mild positive correlation between the proportion of Immigrants from Canada and percentage of family households in the United States with a correlation coefficient (R) of 0.322 and weighted average of 64.0%. Similarly, the statistical analysis conducted on geographies consisting of 473,910,388 people shows a weak positive correlation between the proportion of Danes and percentage of family households in the United States with a correlation coefficient (R) of 0.269 and weighted average of 66.0%, a difference of 3.2%.
Family Households Correlation Summary
| Measurement | Immigrants from Canada | Danish |
| Minimum | 37.5% | 29.2% |
| Maximum | 100.0% | 100.0% |
| Range | 62.5% | 70.8% |
| Mean | 65.7% | 73.3% |
| Median | 63.1% | 72.9% |
| Interquartile 25% (IQ1) | 54.2% | 65.2% |
| Interquartile 75% (IQ3) | 73.4% | 79.2% |
| Interquartile Range (IQR) | 19.2% | 14.0% |
| Standard Deviation (Sample) | 16.4% | 14.9% |
| Standard Deviation (Population) | 16.2% | 14.8% |
Similar Demographics by Family Households
Demographics Similar to Immigrants from Canada by Family Households
In terms of family households, the demographic groups most similar to Immigrants from Canada are Seminole (64.0%, a difference of 0.010%), Polish (64.0%, a difference of 0.010%), Slavic (64.0%, a difference of 0.010%), Immigrants from North America (64.0%, a difference of 0.020%), and Immigrants from Malaysia (64.0%, a difference of 0.030%).
| Demographics | Rating | Rank | Family Households |
| Immigrants | Western Asia | 25.3 /100 | #189 | Fair 64.1% |
| Zimbabweans | 24.7 /100 | #190 | Fair 64.1% |
| Arabs | 24.5 /100 | #191 | Fair 64.1% |
| Lithuanians | 23.8 /100 | #192 | Fair 64.0% |
| French | 23.7 /100 | #193 | Fair 64.0% |
| Paiute | 22.2 /100 | #194 | Fair 64.0% |
| Immigrants | North America | 20.0 /100 | #195 | Poor 64.0% |
| Immigrants | Canada | 19.2 /100 | #196 | Poor 64.0% |
| Seminole | 18.9 /100 | #197 | Poor 64.0% |
| Poles | 18.9 /100 | #198 | Poor 64.0% |
| Slavs | 18.6 /100 | #199 | Poor 64.0% |
| Immigrants | Malaysia | 17.9 /100 | #200 | Poor 64.0% |
| Immigrants | Eastern Europe | 17.2 /100 | #201 | Poor 64.0% |
| Iranians | 13.5 /100 | #202 | Poor 63.9% |
| Norwegians | 13.2 /100 | #203 | Poor 63.9% |
Demographics Similar to Danes by Family Households
In terms of family households, the demographic groups most similar to Danes are South American (66.0%, a difference of 0.020%), Immigrants from Korea (66.0%, a difference of 0.030%), Central American (66.0%, a difference of 0.030%), Immigrants from Asia (66.1%, a difference of 0.050%), and Immigrants from Indonesia (66.0%, a difference of 0.070%).
| Demographics | Rating | Rank | Family Households |
| Immigrants | Colombia | 100.0 /100 | #54 | Exceptional 66.3% |
| Immigrants | Immigrants | 100.0 /100 | #55 | Exceptional 66.1% |
| Immigrants | Hong Kong | 100.0 /100 | #56 | Exceptional 66.1% |
| Pennsylvania Germans | 100.0 /100 | #57 | Exceptional 66.1% |
| Immigrants | Asia | 100.0 /100 | #58 | Exceptional 66.1% |
| Immigrants | Korea | 100.0 /100 | #59 | Exceptional 66.0% |
| South Americans | 100.0 /100 | #60 | Exceptional 66.0% |
| Danes | 100.0 /100 | #61 | Exceptional 66.0% |
| Central Americans | 100.0 /100 | #62 | Exceptional 66.0% |
| Immigrants | Indonesia | 100.0 /100 | #63 | Exceptional 66.0% |
| Pima | 99.9 /100 | #64 | Exceptional 65.9% |
| Costa Ricans | 99.9 /100 | #65 | Exceptional 65.9% |
| Fijians | 99.9 /100 | #66 | Exceptional 65.9% |
| Filipinos | 99.9 /100 | #67 | Exceptional 65.9% |
| Japanese | 99.9 /100 | #68 | Exceptional 65.9% |