Immigrants from Cabo Verde vs Danish Family Households
COMPARE
Immigrants from Cabo Verde
Danish
Family Households
Family Households Comparison
Immigrants from Cabo Verde
Danes
61.9%
FAMILY HOUSEHOLDS
0.0/ 100
METRIC RATING
314th/ 347
METRIC RANK
66.0%
FAMILY HOUSEHOLDS
100.0/ 100
METRIC RATING
61st/ 347
METRIC RANK
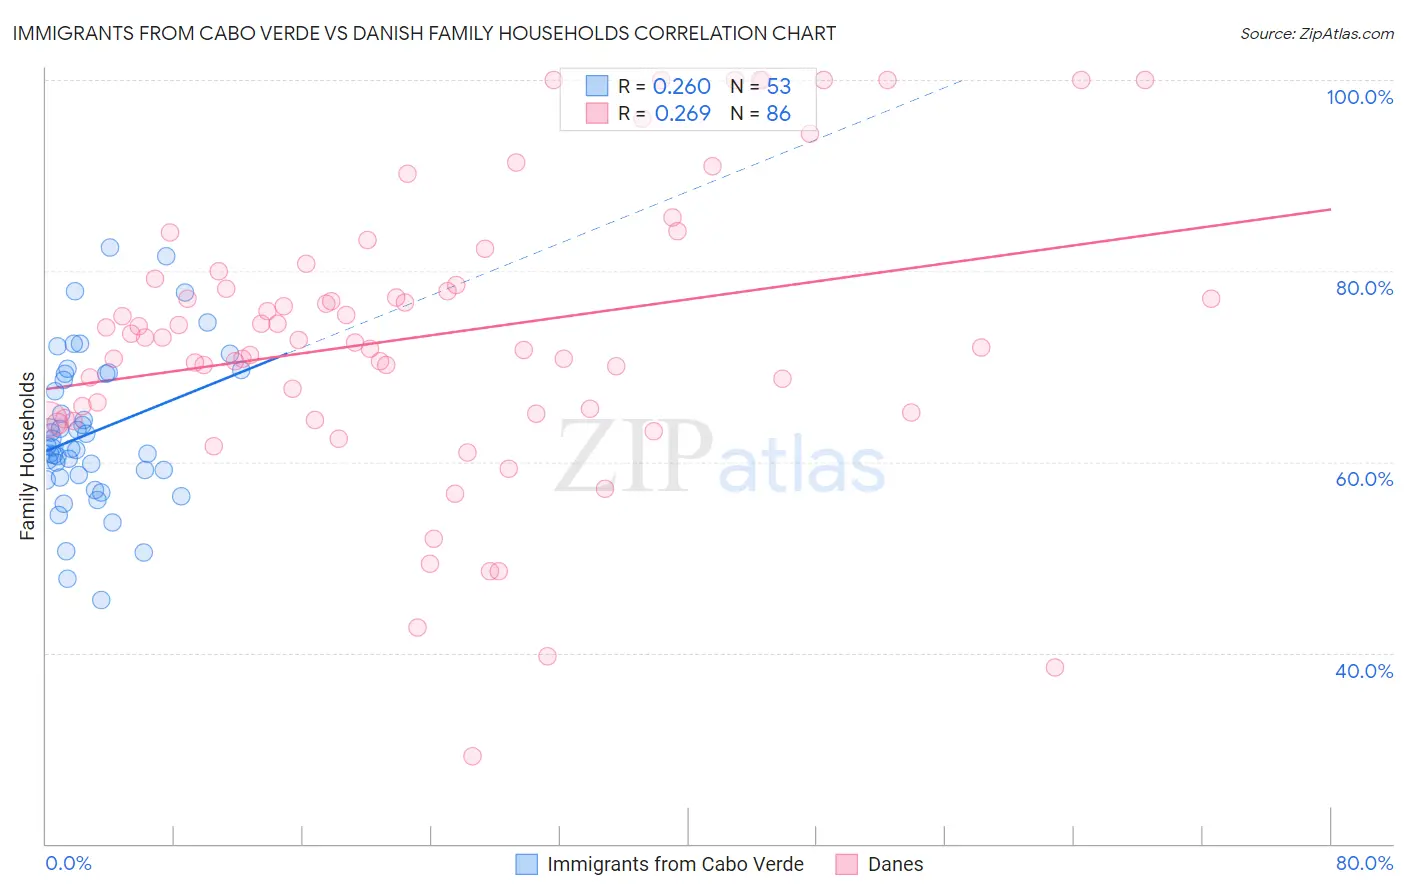
Immigrants from Cabo Verde vs Danish Family Households Correlation Chart
The statistical analysis conducted on geographies consisting of 38,135,369 people shows a weak positive correlation between the proportion of Immigrants from Cabo Verde and percentage of family households in the United States with a correlation coefficient (R) of 0.260 and weighted average of 61.9%. Similarly, the statistical analysis conducted on geographies consisting of 473,910,388 people shows a weak positive correlation between the proportion of Danes and percentage of family households in the United States with a correlation coefficient (R) of 0.269 and weighted average of 66.0%, a difference of 6.6%.
Family Households Correlation Summary
| Measurement | Immigrants from Cabo Verde | Danish |
| Minimum | 45.5% | 29.2% |
| Maximum | 82.5% | 100.0% |
| Range | 37.0% | 70.8% |
| Mean | 63.1% | 73.3% |
| Median | 61.5% | 72.9% |
| Interquartile 25% (IQ1) | 58.5% | 65.2% |
| Interquartile 75% (IQ3) | 69.2% | 79.2% |
| Interquartile Range (IQR) | 10.8% | 14.0% |
| Standard Deviation (Sample) | 7.9% | 14.9% |
| Standard Deviation (Population) | 7.9% | 14.8% |
Similar Demographics by Family Households
Demographics Similar to Immigrants from Cabo Verde by Family Households
In terms of family households, the demographic groups most similar to Immigrants from Cabo Verde are Moroccan (61.9%, a difference of 0.040%), Liberian (62.0%, a difference of 0.050%), Immigrants from Latvia (62.0%, a difference of 0.060%), Immigrants from Middle Africa (61.9%, a difference of 0.080%), and Immigrants from Morocco (62.0%, a difference of 0.10%).
| Demographics | Rating | Rank | Family Households |
| Immigrants | Norway | 0.0 /100 | #307 | Tragic 62.1% |
| Chippewa | 0.0 /100 | #308 | Tragic 62.1% |
| Sub-Saharan Africans | 0.0 /100 | #309 | Tragic 62.1% |
| Immigrants | Liberia | 0.0 /100 | #310 | Tragic 62.0% |
| Immigrants | Morocco | 0.0 /100 | #311 | Tragic 62.0% |
| Immigrants | Latvia | 0.0 /100 | #312 | Tragic 62.0% |
| Liberians | 0.0 /100 | #313 | Tragic 62.0% |
| Immigrants | Cabo Verde | 0.0 /100 | #314 | Tragic 61.9% |
| Moroccans | 0.0 /100 | #315 | Tragic 61.9% |
| Immigrants | Middle Africa | 0.0 /100 | #316 | Tragic 61.9% |
| Immigrants | Bosnia and Herzegovina | 0.0 /100 | #317 | Tragic 61.9% |
| Alaskan Athabascans | 0.0 /100 | #318 | Tragic 61.8% |
| Cape Verdeans | 0.0 /100 | #319 | Tragic 61.8% |
| Ugandans | 0.0 /100 | #320 | Tragic 61.7% |
| Alsatians | 0.0 /100 | #321 | Tragic 61.7% |
Demographics Similar to Danes by Family Households
In terms of family households, the demographic groups most similar to Danes are South American (66.0%, a difference of 0.020%), Immigrants from Korea (66.0%, a difference of 0.030%), Central American (66.0%, a difference of 0.030%), Immigrants from Asia (66.1%, a difference of 0.050%), and Immigrants from Indonesia (66.0%, a difference of 0.070%).
| Demographics | Rating | Rank | Family Households |
| Immigrants | Colombia | 100.0 /100 | #54 | Exceptional 66.3% |
| Immigrants | Immigrants | 100.0 /100 | #55 | Exceptional 66.1% |
| Immigrants | Hong Kong | 100.0 /100 | #56 | Exceptional 66.1% |
| Pennsylvania Germans | 100.0 /100 | #57 | Exceptional 66.1% |
| Immigrants | Asia | 100.0 /100 | #58 | Exceptional 66.1% |
| Immigrants | Korea | 100.0 /100 | #59 | Exceptional 66.0% |
| South Americans | 100.0 /100 | #60 | Exceptional 66.0% |
| Danes | 100.0 /100 | #61 | Exceptional 66.0% |
| Central Americans | 100.0 /100 | #62 | Exceptional 66.0% |
| Immigrants | Indonesia | 100.0 /100 | #63 | Exceptional 66.0% |
| Pima | 99.9 /100 | #64 | Exceptional 65.9% |
| Costa Ricans | 99.9 /100 | #65 | Exceptional 65.9% |
| Fijians | 99.9 /100 | #66 | Exceptional 65.9% |
| Filipinos | 99.9 /100 | #67 | Exceptional 65.9% |
| Japanese | 99.9 /100 | #68 | Exceptional 65.9% |