Macedonian vs Ugandan Family Households
COMPARE
Macedonian
Ugandan
Family Households
Family Households Comparison
Macedonians
Ugandans
63.7%
FAMILY HOUSEHOLDS
6.5/ 100
METRIC RATING
219th/ 347
METRIC RANK
61.7%
FAMILY HOUSEHOLDS
0.0/ 100
METRIC RATING
320th/ 347
METRIC RANK
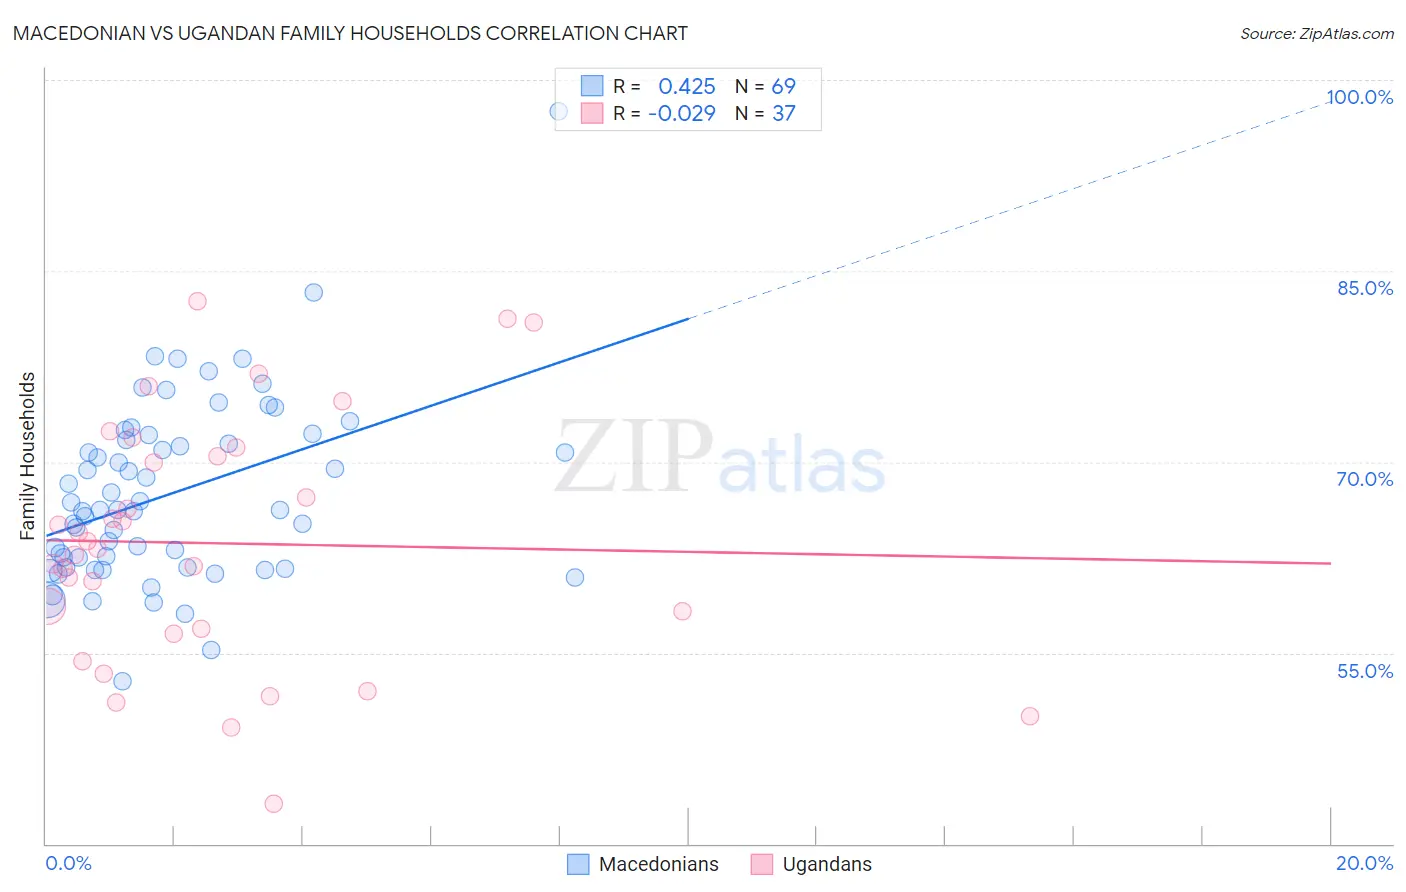
Macedonian vs Ugandan Family Households Correlation Chart
The statistical analysis conducted on geographies consisting of 132,622,141 people shows a moderate positive correlation between the proportion of Macedonians and percentage of family households in the United States with a correlation coefficient (R) of 0.425 and weighted average of 63.7%. Similarly, the statistical analysis conducted on geographies consisting of 93,998,948 people shows no correlation between the proportion of Ugandans and percentage of family households in the United States with a correlation coefficient (R) of -0.029 and weighted average of 61.7%, a difference of 3.3%.
Family Households Correlation Summary
| Measurement | Macedonian | Ugandan |
| Minimum | 52.7% | 43.1% |
| Maximum | 97.6% | 82.6% |
| Range | 44.8% | 39.5% |
| Mean | 67.5% | 63.6% |
| Median | 66.2% | 63.1% |
| Interquartile 25% (IQ1) | 61.7% | 56.7% |
| Interquartile 75% (IQ3) | 72.0% | 70.8% |
| Interquartile Range (IQR) | 10.2% | 14.1% |
| Standard Deviation (Sample) | 7.2% | 9.7% |
| Standard Deviation (Population) | 7.2% | 9.5% |
Similar Demographics by Family Households
Demographics Similar to Macedonians by Family Households
In terms of family households, the demographic groups most similar to Macedonians are Immigrants from Europe (63.7%, a difference of 0.010%), Osage (63.7%, a difference of 0.030%), Marshallese (63.7%, a difference of 0.030%), Immigrants from South Africa (63.7%, a difference of 0.030%), and Croatian (63.8%, a difference of 0.040%).
| Demographics | Rating | Rank | Family Households |
| Immigrants | Netherlands | 9.4 /100 | #212 | Tragic 63.8% |
| Immigrants | Northern Europe | 8.8 /100 | #213 | Tragic 63.8% |
| Celtics | 8.0 /100 | #214 | Tragic 63.8% |
| Belgians | 7.6 /100 | #215 | Tragic 63.8% |
| Croatians | 7.3 /100 | #216 | Tragic 63.8% |
| Osage | 7.0 /100 | #217 | Tragic 63.7% |
| Marshallese | 6.9 /100 | #218 | Tragic 63.7% |
| Macedonians | 6.5 /100 | #219 | Tragic 63.7% |
| Immigrants | Europe | 6.4 /100 | #220 | Tragic 63.7% |
| Immigrants | South Africa | 5.9 /100 | #221 | Tragic 63.7% |
| Immigrants | Belarus | 5.5 /100 | #222 | Tragic 63.7% |
| French Canadians | 5.4 /100 | #223 | Tragic 63.7% |
| Turks | 4.5 /100 | #224 | Tragic 63.6% |
| Immigrants | Hungary | 4.3 /100 | #225 | Tragic 63.6% |
| Immigrants | Bahamas | 4.2 /100 | #226 | Tragic 63.6% |
Demographics Similar to Ugandans by Family Households
In terms of family households, the demographic groups most similar to Ugandans are Alsatian (61.7%, a difference of 0.050%), Cape Verdean (61.8%, a difference of 0.12%), Immigrants from Serbia (61.6%, a difference of 0.14%), Tlingit-Haida (61.6%, a difference of 0.15%), and Immigrants from West Indies (61.6%, a difference of 0.16%).
| Demographics | Rating | Rank | Family Households |
| Liberians | 0.0 /100 | #313 | Tragic 62.0% |
| Immigrants | Cabo Verde | 0.0 /100 | #314 | Tragic 61.9% |
| Moroccans | 0.0 /100 | #315 | Tragic 61.9% |
| Immigrants | Middle Africa | 0.0 /100 | #316 | Tragic 61.9% |
| Immigrants | Bosnia and Herzegovina | 0.0 /100 | #317 | Tragic 61.9% |
| Alaskan Athabascans | 0.0 /100 | #318 | Tragic 61.8% |
| Cape Verdeans | 0.0 /100 | #319 | Tragic 61.8% |
| Ugandans | 0.0 /100 | #320 | Tragic 61.7% |
| Alsatians | 0.0 /100 | #321 | Tragic 61.7% |
| Immigrants | Serbia | 0.0 /100 | #322 | Tragic 61.6% |
| Tlingit-Haida | 0.0 /100 | #323 | Tragic 61.6% |
| Immigrants | West Indies | 0.0 /100 | #324 | Tragic 61.6% |
| Immigrants | Switzerland | 0.0 /100 | #325 | Tragic 61.6% |
| Indonesians | 0.0 /100 | #326 | Tragic 61.5% |
| Blacks/African Americans | 0.0 /100 | #327 | Tragic 61.5% |