Macedonian vs Immigrants from Kenya Family Households
COMPARE
Macedonian
Immigrants from Kenya
Family Households
Family Households Comparison
Macedonians
Immigrants from Kenya
63.7%
FAMILY HOUSEHOLDS
6.5/ 100
METRIC RATING
219th/ 347
METRIC RANK
62.3%
FAMILY HOUSEHOLDS
0.0/ 100
METRIC RATING
302nd/ 347
METRIC RANK
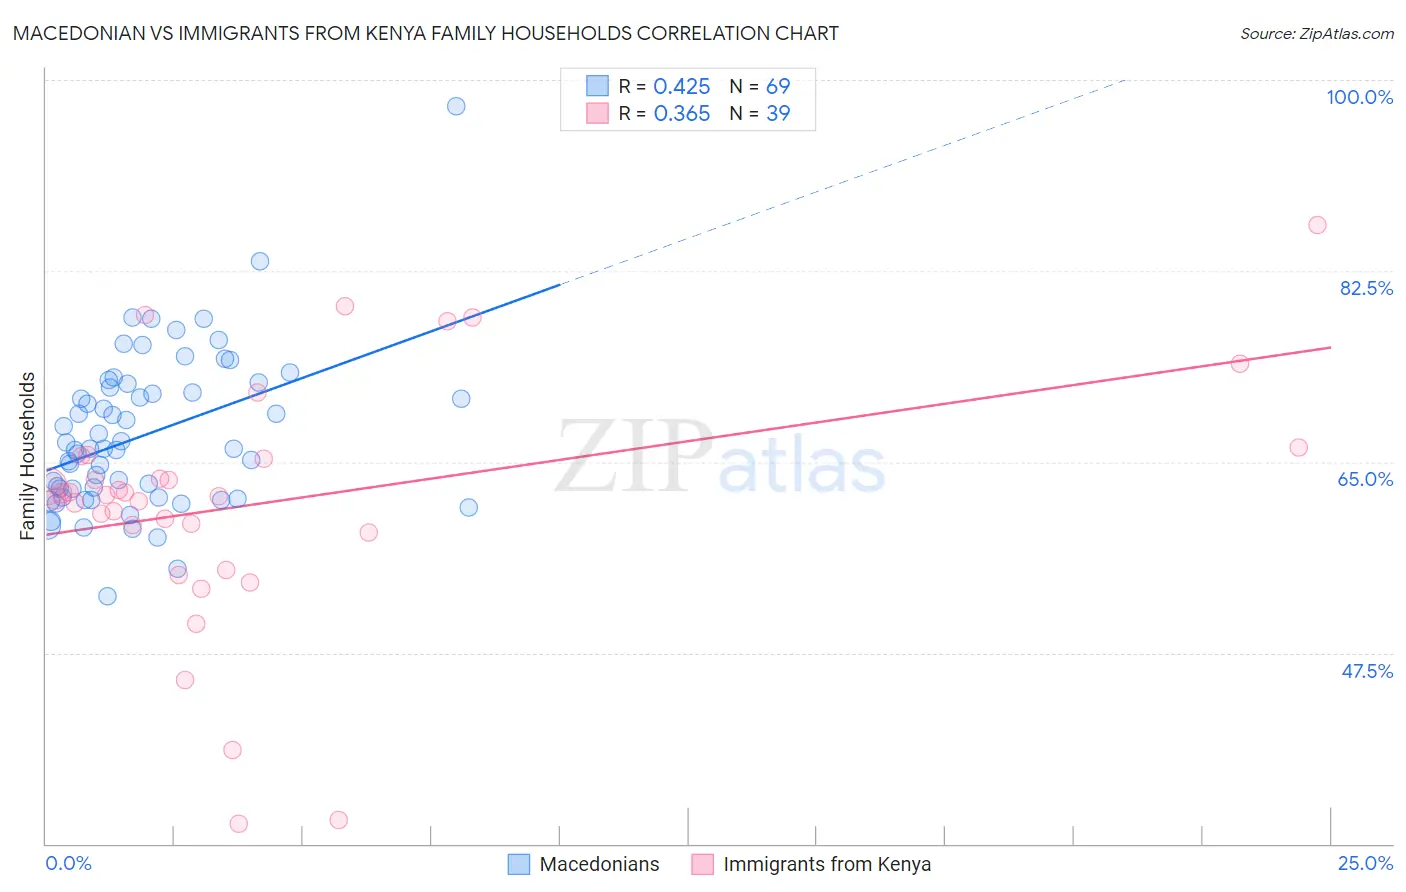
Macedonian vs Immigrants from Kenya Family Households Correlation Chart
The statistical analysis conducted on geographies consisting of 132,622,141 people shows a moderate positive correlation between the proportion of Macedonians and percentage of family households in the United States with a correlation coefficient (R) of 0.425 and weighted average of 63.7%. Similarly, the statistical analysis conducted on geographies consisting of 217,999,239 people shows a mild positive correlation between the proportion of Immigrants from Kenya and percentage of family households in the United States with a correlation coefficient (R) of 0.365 and weighted average of 62.3%, a difference of 2.2%.
Family Households Correlation Summary
| Measurement | Macedonian | Immigrants from Kenya |
| Minimum | 52.7% | 31.8% |
| Maximum | 97.6% | 86.7% |
| Range | 44.8% | 54.9% |
| Mean | 67.5% | 61.3% |
| Median | 66.2% | 62.0% |
| Interquartile 25% (IQ1) | 61.7% | 58.5% |
| Interquartile 75% (IQ3) | 72.0% | 65.5% |
| Interquartile Range (IQR) | 10.2% | 7.0% |
| Standard Deviation (Sample) | 7.2% | 11.5% |
| Standard Deviation (Population) | 7.2% | 11.4% |
Similar Demographics by Family Households
Demographics Similar to Macedonians by Family Households
In terms of family households, the demographic groups most similar to Macedonians are Immigrants from Europe (63.7%, a difference of 0.010%), Osage (63.7%, a difference of 0.030%), Marshallese (63.7%, a difference of 0.030%), Immigrants from South Africa (63.7%, a difference of 0.030%), and Croatian (63.8%, a difference of 0.040%).
| Demographics | Rating | Rank | Family Households |
| Immigrants | Netherlands | 9.4 /100 | #212 | Tragic 63.8% |
| Immigrants | Northern Europe | 8.8 /100 | #213 | Tragic 63.8% |
| Celtics | 8.0 /100 | #214 | Tragic 63.8% |
| Belgians | 7.6 /100 | #215 | Tragic 63.8% |
| Croatians | 7.3 /100 | #216 | Tragic 63.8% |
| Osage | 7.0 /100 | #217 | Tragic 63.7% |
| Marshallese | 6.9 /100 | #218 | Tragic 63.7% |
| Macedonians | 6.5 /100 | #219 | Tragic 63.7% |
| Immigrants | Europe | 6.4 /100 | #220 | Tragic 63.7% |
| Immigrants | South Africa | 5.9 /100 | #221 | Tragic 63.7% |
| Immigrants | Belarus | 5.5 /100 | #222 | Tragic 63.7% |
| French Canadians | 5.4 /100 | #223 | Tragic 63.7% |
| Turks | 4.5 /100 | #224 | Tragic 63.6% |
| Immigrants | Hungary | 4.3 /100 | #225 | Tragic 63.6% |
| Immigrants | Bahamas | 4.2 /100 | #226 | Tragic 63.6% |
Demographics Similar to Immigrants from Kenya by Family Households
In terms of family households, the demographic groups most similar to Immigrants from Kenya are Immigrants from Albania (62.4%, a difference of 0.040%), Immigrants from Africa (62.4%, a difference of 0.060%), Cree (62.3%, a difference of 0.060%), Immigrants from Kuwait (62.4%, a difference of 0.070%), and Immigrants from Spain (62.4%, a difference of 0.13%).
| Demographics | Rating | Rank | Family Households |
| Okinawans | 0.0 /100 | #295 | Tragic 62.5% |
| Slovenes | 0.0 /100 | #296 | Tragic 62.4% |
| French American Indians | 0.0 /100 | #297 | Tragic 62.4% |
| Immigrants | Spain | 0.0 /100 | #298 | Tragic 62.4% |
| Immigrants | Kuwait | 0.0 /100 | #299 | Tragic 62.4% |
| Immigrants | Africa | 0.0 /100 | #300 | Tragic 62.4% |
| Immigrants | Albania | 0.0 /100 | #301 | Tragic 62.4% |
| Immigrants | Kenya | 0.0 /100 | #302 | Tragic 62.3% |
| Cree | 0.0 /100 | #303 | Tragic 62.3% |
| Iroquois | 0.0 /100 | #304 | Tragic 62.2% |
| Bermudans | 0.0 /100 | #305 | Tragic 62.2% |
| Africans | 0.0 /100 | #306 | Tragic 62.1% |
| Immigrants | Norway | 0.0 /100 | #307 | Tragic 62.1% |
| Chippewa | 0.0 /100 | #308 | Tragic 62.1% |
| Sub-Saharan Africans | 0.0 /100 | #309 | Tragic 62.1% |