Macedonian vs Ugandan Family Poverty
COMPARE
Macedonian
Ugandan
Family Poverty
Family Poverty Comparison
Macedonians
Ugandans
7.8%
FAMILY POVERTY
98.6/ 100
METRIC RATING
62nd/ 347
METRIC RANK
9.3%
FAMILY POVERTY
28.7/ 100
METRIC RATING
191st/ 347
METRIC RANK
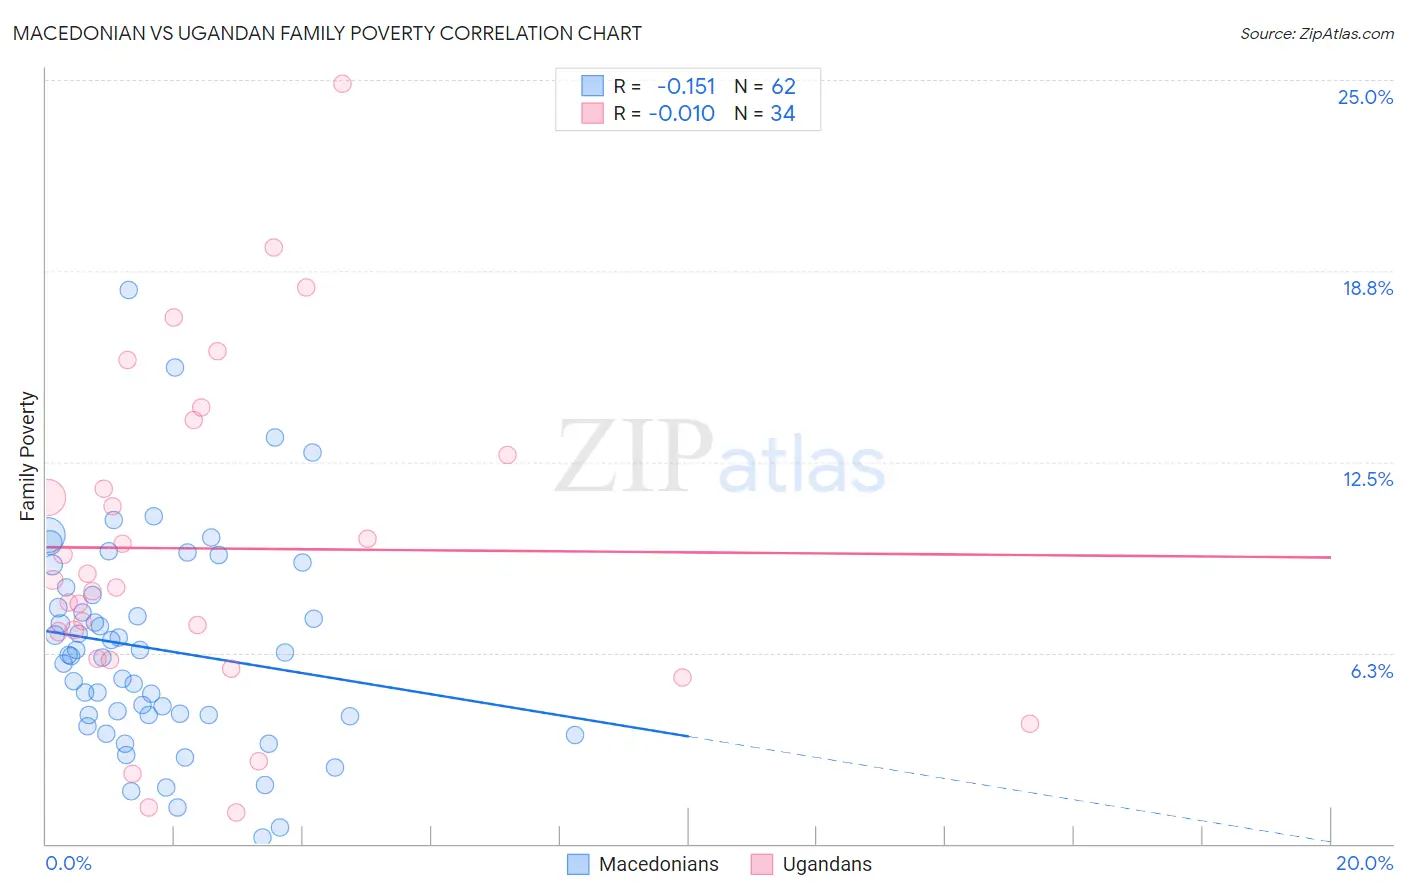
Macedonian vs Ugandan Family Poverty Correlation Chart
The statistical analysis conducted on geographies consisting of 132,470,944 people shows a poor negative correlation between the proportion of Macedonians and poverty level among families in the United States with a correlation coefficient (R) of -0.151 and weighted average of 7.8%. Similarly, the statistical analysis conducted on geographies consisting of 93,955,553 people shows no correlation between the proportion of Ugandans and poverty level among families in the United States with a correlation coefficient (R) of -0.010 and weighted average of 9.3%, a difference of 19.5%.
Family Poverty Correlation Summary
| Measurement | Macedonian | Ugandan |
| Minimum | 0.19% | 1.0% |
| Maximum | 18.1% | 24.9% |
| Range | 17.9% | 23.8% |
| Mean | 6.4% | 9.7% |
| Median | 6.2% | 8.5% |
| Interquartile 25% (IQ1) | 4.2% | 6.0% |
| Interquartile 75% (IQ3) | 8.1% | 12.7% |
| Interquartile Range (IQR) | 3.9% | 6.7% |
| Standard Deviation (Sample) | 3.5% | 5.4% |
| Standard Deviation (Population) | 3.4% | 5.4% |
Similar Demographics by Family Poverty
Demographics Similar to Macedonians by Family Poverty
In terms of family poverty, the demographic groups most similar to Macedonians are Immigrants from Netherlands (7.7%, a difference of 0.19%), Immigrants from Greece (7.7%, a difference of 0.37%), European (7.7%, a difference of 0.38%), Finnish (7.7%, a difference of 0.39%), and Asian (7.7%, a difference of 0.42%).
| Demographics | Rating | Rank | Family Poverty |
| Immigrants | Eastern Asia | 98.7 /100 | #55 | Exceptional 7.7% |
| Immigrants | Serbia | 98.7 /100 | #56 | Exceptional 7.7% |
| Asians | 98.7 /100 | #57 | Exceptional 7.7% |
| Finns | 98.7 /100 | #58 | Exceptional 7.7% |
| Europeans | 98.7 /100 | #59 | Exceptional 7.7% |
| Immigrants | Greece | 98.7 /100 | #60 | Exceptional 7.7% |
| Immigrants | Netherlands | 98.6 /100 | #61 | Exceptional 7.7% |
| Macedonians | 98.6 /100 | #62 | Exceptional 7.8% |
| Zimbabweans | 98.4 /100 | #63 | Exceptional 7.8% |
| Koreans | 98.3 /100 | #64 | Exceptional 7.8% |
| Immigrants | Bulgaria | 98.3 /100 | #65 | Exceptional 7.8% |
| Dutch | 98.3 /100 | #66 | Exceptional 7.8% |
| Northern Europeans | 98.3 /100 | #67 | Exceptional 7.8% |
| Australians | 98.2 /100 | #68 | Exceptional 7.8% |
| Immigrants | Belgium | 98.2 /100 | #69 | Exceptional 7.8% |
Demographics Similar to Ugandans by Family Poverty
In terms of family poverty, the demographic groups most similar to Ugandans are Spanish (9.3%, a difference of 0.010%), Immigrants from Western Asia (9.3%, a difference of 0.080%), South American (9.3%, a difference of 0.10%), Venezuelan (9.3%, a difference of 0.22%), and Arab (9.2%, a difference of 0.41%).
| Demographics | Rating | Rank | Family Poverty |
| South American Indians | 38.7 /100 | #184 | Fair 9.1% |
| Immigrants | Saudi Arabia | 38.6 /100 | #185 | Fair 9.1% |
| Colombians | 36.1 /100 | #186 | Fair 9.2% |
| Delaware | 35.4 /100 | #187 | Fair 9.2% |
| Immigrants | Kenya | 34.0 /100 | #188 | Fair 9.2% |
| Immigrants | Afghanistan | 32.1 /100 | #189 | Fair 9.2% |
| Arabs | 31.5 /100 | #190 | Fair 9.2% |
| Ugandans | 28.7 /100 | #191 | Fair 9.3% |
| Spanish | 28.7 /100 | #192 | Fair 9.3% |
| Immigrants | Western Asia | 28.2 /100 | #193 | Fair 9.3% |
| South Americans | 28.1 /100 | #194 | Fair 9.3% |
| Venezuelans | 27.4 /100 | #195 | Fair 9.3% |
| Immigrants | Venezuela | 26.1 /100 | #196 | Fair 9.3% |
| Immigrants | Colombia | 24.4 /100 | #197 | Fair 9.3% |
| Iraqis | 24.2 /100 | #198 | Fair 9.3% |