Latvian vs Ugandan Family Households
COMPARE
Latvian
Ugandan
Family Households
Family Households Comparison
Latvians
Ugandans
62.8%
FAMILY HOUSEHOLDS
0.1/ 100
METRIC RATING
287th/ 347
METRIC RANK
61.7%
FAMILY HOUSEHOLDS
0.0/ 100
METRIC RATING
320th/ 347
METRIC RANK
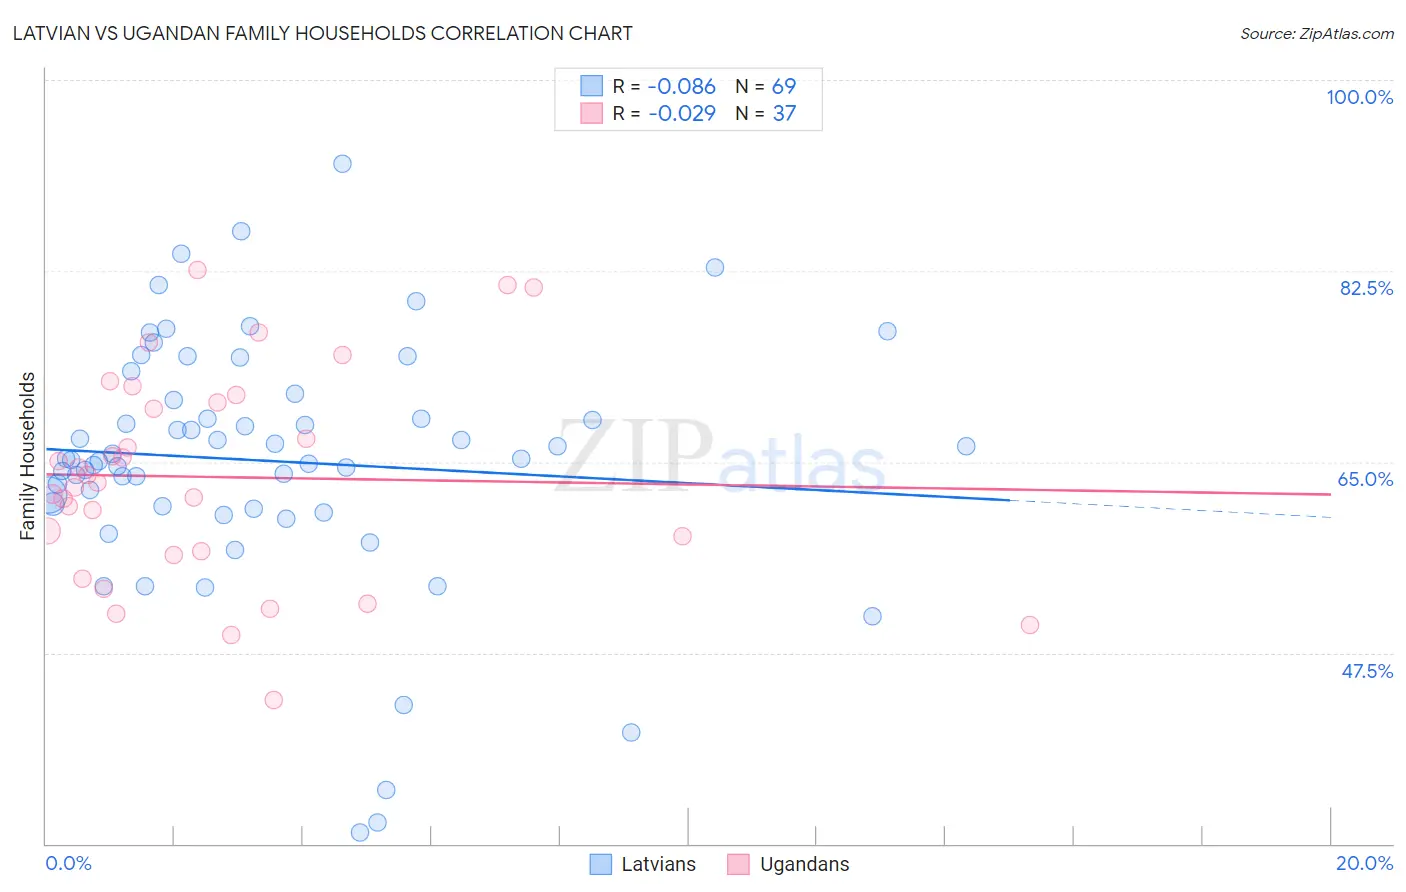
Latvian vs Ugandan Family Households Correlation Chart
The statistical analysis conducted on geographies consisting of 220,652,081 people shows a slight negative correlation between the proportion of Latvians and percentage of family households in the United States with a correlation coefficient (R) of -0.086 and weighted average of 62.8%. Similarly, the statistical analysis conducted on geographies consisting of 93,998,948 people shows no correlation between the proportion of Ugandans and percentage of family households in the United States with a correlation coefficient (R) of -0.029 and weighted average of 61.7%, a difference of 1.7%.
Family Households Correlation Summary
| Measurement | Latvian | Ugandan |
| Minimum | 31.0% | 43.1% |
| Maximum | 92.3% | 82.6% |
| Range | 61.3% | 39.5% |
| Mean | 65.1% | 63.6% |
| Median | 65.3% | 63.1% |
| Interquartile 25% (IQ1) | 60.8% | 56.7% |
| Interquartile 75% (IQ3) | 70.9% | 70.8% |
| Interquartile Range (IQR) | 10.1% | 14.1% |
| Standard Deviation (Sample) | 11.5% | 9.7% |
| Standard Deviation (Population) | 11.4% | 9.5% |
Similar Demographics by Family Households
Demographics Similar to Latvians by Family Households
In terms of family households, the demographic groups most similar to Latvians are British West Indian (62.8%, a difference of 0.0%), Immigrants from Uganda (62.7%, a difference of 0.020%), Mongolian (62.8%, a difference of 0.030%), Immigrants from Nepal (62.7%, a difference of 0.11%), and Australian (62.8%, a difference of 0.14%).
| Demographics | Rating | Rank | Family Households |
| Immigrants | Bulgaria | 0.2 /100 | #280 | Tragic 63.0% |
| Estonians | 0.2 /100 | #281 | Tragic 62.9% |
| New Zealanders | 0.1 /100 | #282 | Tragic 62.9% |
| Immigrants | Denmark | 0.1 /100 | #283 | Tragic 62.9% |
| Australians | 0.1 /100 | #284 | Tragic 62.8% |
| Mongolians | 0.1 /100 | #285 | Tragic 62.8% |
| British West Indians | 0.1 /100 | #286 | Tragic 62.8% |
| Latvians | 0.1 /100 | #287 | Tragic 62.8% |
| Immigrants | Uganda | 0.1 /100 | #288 | Tragic 62.7% |
| Immigrants | Nepal | 0.1 /100 | #289 | Tragic 62.7% |
| Immigrants | Grenada | 0.0 /100 | #290 | Tragic 62.6% |
| U.S. Virgin Islanders | 0.0 /100 | #291 | Tragic 62.6% |
| Immigrants | Burma/Myanmar | 0.0 /100 | #292 | Tragic 62.6% |
| Immigrants | Sweden | 0.0 /100 | #293 | Tragic 62.5% |
| Barbadians | 0.0 /100 | #294 | Tragic 62.5% |
Demographics Similar to Ugandans by Family Households
In terms of family households, the demographic groups most similar to Ugandans are Alsatian (61.7%, a difference of 0.050%), Cape Verdean (61.8%, a difference of 0.12%), Immigrants from Serbia (61.6%, a difference of 0.14%), Tlingit-Haida (61.6%, a difference of 0.15%), and Immigrants from West Indies (61.6%, a difference of 0.16%).
| Demographics | Rating | Rank | Family Households |
| Liberians | 0.0 /100 | #313 | Tragic 62.0% |
| Immigrants | Cabo Verde | 0.0 /100 | #314 | Tragic 61.9% |
| Moroccans | 0.0 /100 | #315 | Tragic 61.9% |
| Immigrants | Middle Africa | 0.0 /100 | #316 | Tragic 61.9% |
| Immigrants | Bosnia and Herzegovina | 0.0 /100 | #317 | Tragic 61.9% |
| Alaskan Athabascans | 0.0 /100 | #318 | Tragic 61.8% |
| Cape Verdeans | 0.0 /100 | #319 | Tragic 61.8% |
| Ugandans | 0.0 /100 | #320 | Tragic 61.7% |
| Alsatians | 0.0 /100 | #321 | Tragic 61.7% |
| Immigrants | Serbia | 0.0 /100 | #322 | Tragic 61.6% |
| Tlingit-Haida | 0.0 /100 | #323 | Tragic 61.6% |
| Immigrants | West Indies | 0.0 /100 | #324 | Tragic 61.6% |
| Immigrants | Switzerland | 0.0 /100 | #325 | Tragic 61.6% |
| Indonesians | 0.0 /100 | #326 | Tragic 61.5% |
| Blacks/African Americans | 0.0 /100 | #327 | Tragic 61.5% |