Macedonian vs Immigrants from Denmark Family Households
COMPARE
Macedonian
Immigrants from Denmark
Family Households
Family Households Comparison
Macedonians
Immigrants from Denmark
63.7%
FAMILY HOUSEHOLDS
6.5/ 100
METRIC RATING
219th/ 347
METRIC RANK
62.9%
FAMILY HOUSEHOLDS
0.1/ 100
METRIC RATING
283rd/ 347
METRIC RANK
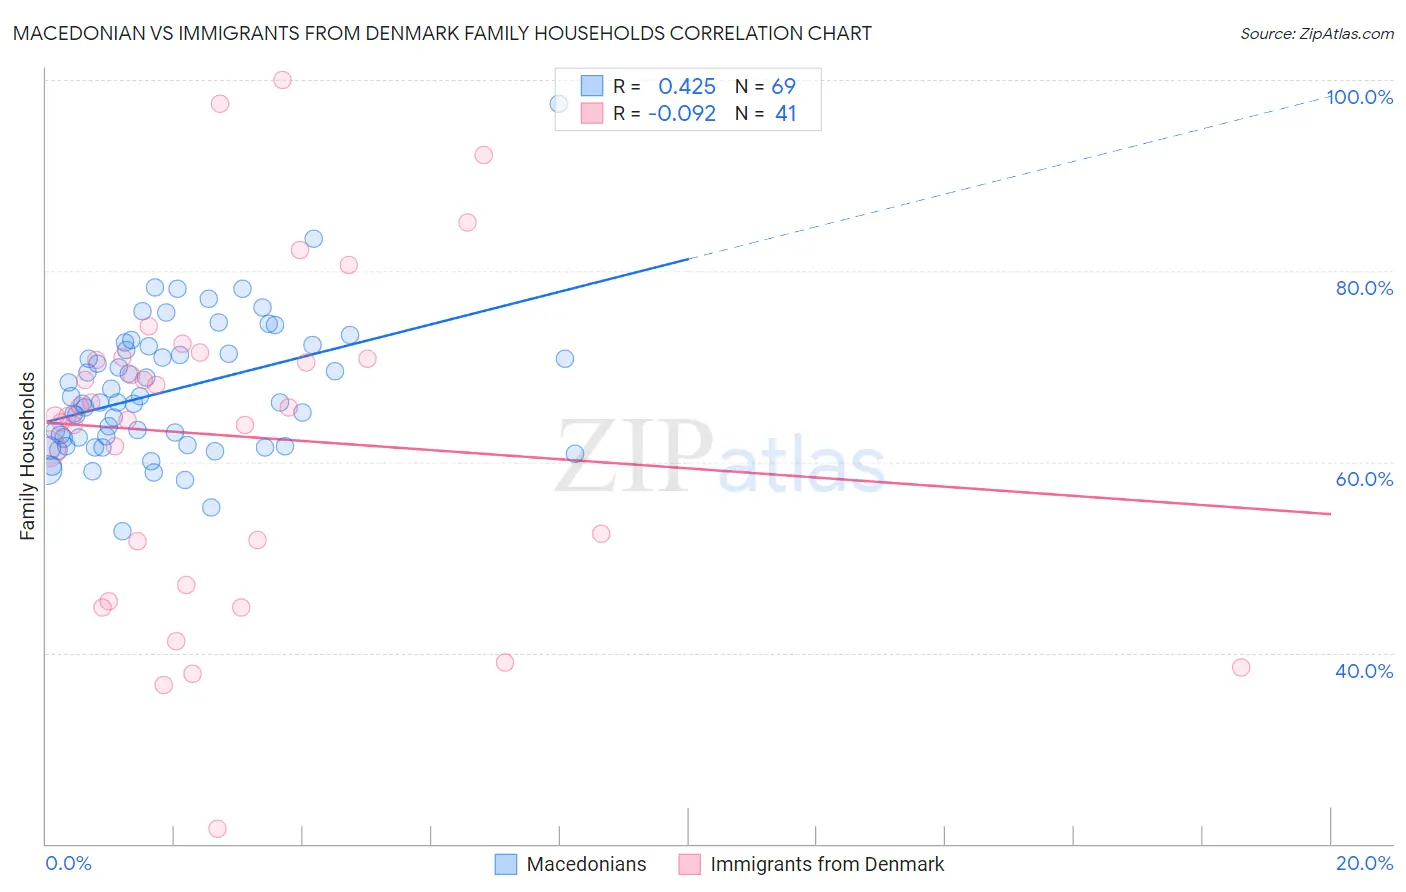
Macedonian vs Immigrants from Denmark Family Households Correlation Chart
The statistical analysis conducted on geographies consisting of 132,622,141 people shows a moderate positive correlation between the proportion of Macedonians and percentage of family households in the United States with a correlation coefficient (R) of 0.425 and weighted average of 63.7%. Similarly, the statistical analysis conducted on geographies consisting of 136,405,039 people shows a slight negative correlation between the proportion of Immigrants from Denmark and percentage of family households in the United States with a correlation coefficient (R) of -0.092 and weighted average of 62.9%, a difference of 1.3%.
Family Households Correlation Summary
| Measurement | Macedonian | Immigrants from Denmark |
| Minimum | 52.7% | 21.6% |
| Maximum | 97.6% | 100.0% |
| Range | 44.8% | 78.4% |
| Mean | 67.5% | 62.7% |
| Median | 66.2% | 64.8% |
| Interquartile 25% (IQ1) | 61.7% | 49.4% |
| Interquartile 75% (IQ3) | 72.0% | 70.9% |
| Interquartile Range (IQR) | 10.2% | 21.5% |
| Standard Deviation (Sample) | 7.2% | 17.0% |
| Standard Deviation (Population) | 7.2% | 16.8% |
Similar Demographics by Family Households
Demographics Similar to Macedonians by Family Households
In terms of family households, the demographic groups most similar to Macedonians are Immigrants from Europe (63.7%, a difference of 0.010%), Osage (63.7%, a difference of 0.030%), Marshallese (63.7%, a difference of 0.030%), Immigrants from South Africa (63.7%, a difference of 0.030%), and Croatian (63.8%, a difference of 0.040%).
| Demographics | Rating | Rank | Family Households |
| Immigrants | Netherlands | 9.4 /100 | #212 | Tragic 63.8% |
| Immigrants | Northern Europe | 8.8 /100 | #213 | Tragic 63.8% |
| Celtics | 8.0 /100 | #214 | Tragic 63.8% |
| Belgians | 7.6 /100 | #215 | Tragic 63.8% |
| Croatians | 7.3 /100 | #216 | Tragic 63.8% |
| Osage | 7.0 /100 | #217 | Tragic 63.7% |
| Marshallese | 6.9 /100 | #218 | Tragic 63.7% |
| Macedonians | 6.5 /100 | #219 | Tragic 63.7% |
| Immigrants | Europe | 6.4 /100 | #220 | Tragic 63.7% |
| Immigrants | South Africa | 5.9 /100 | #221 | Tragic 63.7% |
| Immigrants | Belarus | 5.5 /100 | #222 | Tragic 63.7% |
| French Canadians | 5.4 /100 | #223 | Tragic 63.7% |
| Turks | 4.5 /100 | #224 | Tragic 63.6% |
| Immigrants | Hungary | 4.3 /100 | #225 | Tragic 63.6% |
| Immigrants | Bahamas | 4.2 /100 | #226 | Tragic 63.6% |
Demographics Similar to Immigrants from Denmark by Family Households
In terms of family households, the demographic groups most similar to Immigrants from Denmark are New Zealander (62.9%, a difference of 0.010%), Estonian (62.9%, a difference of 0.040%), Australian (62.8%, a difference of 0.040%), Immigrants from Bulgaria (63.0%, a difference of 0.13%), and Immigrants from Yemen (63.0%, a difference of 0.15%).
| Demographics | Rating | Rank | Family Households |
| Serbians | 0.3 /100 | #276 | Tragic 63.0% |
| Ottawa | 0.3 /100 | #277 | Tragic 63.0% |
| Immigrants | Belgium | 0.2 /100 | #278 | Tragic 63.0% |
| Immigrants | Yemen | 0.2 /100 | #279 | Tragic 63.0% |
| Immigrants | Bulgaria | 0.2 /100 | #280 | Tragic 63.0% |
| Estonians | 0.2 /100 | #281 | Tragic 62.9% |
| New Zealanders | 0.1 /100 | #282 | Tragic 62.9% |
| Immigrants | Denmark | 0.1 /100 | #283 | Tragic 62.9% |
| Australians | 0.1 /100 | #284 | Tragic 62.8% |
| Mongolians | 0.1 /100 | #285 | Tragic 62.8% |
| British West Indians | 0.1 /100 | #286 | Tragic 62.8% |
| Latvians | 0.1 /100 | #287 | Tragic 62.8% |
| Immigrants | Uganda | 0.1 /100 | #288 | Tragic 62.7% |
| Immigrants | Nepal | 0.1 /100 | #289 | Tragic 62.7% |
| Immigrants | Grenada | 0.0 /100 | #290 | Tragic 62.6% |