Czechoslovakian vs Ugandan Family Households

COMPARE

Czechoslovakian
Race
Ancestry
AfghanAfricanAlaska NativeAlaskan AthabascanAlbanianAleutAlsatianAmericanApacheArabArapahoArgentineanArmenianAssyrian/Chaldean/SyriacAustralianAustrianBahamianBangladeshiBarbadianBasqueBelgianBelizeanBermudanBhutaneseBlackfeetBolivianBrazilianBritishBritish West IndianBulgarianBurmeseCajunCambodianCanadianCape VerdeanCarpatho RusynCelticCentral AmericanCentral American IndianCherokeeCheyenneChickasawChileanChineseChippewaChoctawColombianColvilleComancheCosta RicanCreeCreekCroatianCrowCubanCypriotCzechCzechoslovakianDanishDelawareDominicanDutchDutch West IndianEastern EuropeanEcuadorianEgyptianEnglishEstonianEthiopianEuropeanFijianFilipinoFinnishFrenchFrench American IndianFrench CanadianGermanGerman RussianGhanaianGreekGuamanian/ChamorroGuatemalanGuyaneseHaitianHmongHonduranHopiHoumaHungarianIcelanderIndian (Asian)IndonesianInupiatIranianIraqiIrishIroquoisIsraeliItalianJamaicanJapaneseJordanianKenyanKiowaKoreanLaotianLatvianLebaneseLiberianLithuanianLumbeeLuxembourgerMacedonianMalaysianMalteseMarshalleseMenomineeMexicanMexican American IndianMongolianMoroccanNative HawaiianNavajoNepaleseNew ZealanderNicaraguanNigerianNorthern EuropeanNorwegianOkinawanOsageOttawaPaiutePakistaniPalestinianPanamanianParaguayanPennsylvania GermanPeruvianPimaPolishPortuguesePotawatomiPuebloPuerto RicanPuget Sound SalishRomanianRussianSalvadoranSamoanScandinavianScotch-IrishScottishSeminoleSenegaleseSerbianShoshoneSierra LeoneanSiouxSlavicSlovakSloveneSomaliSouth AfricanSouth AmericanSouth American IndianSoviet UnionSpaniardSpanishSpanish AmericanSpanish American IndianSri LankanSubsaharan AfricanSudaneseSwedishSwissSyrianTaiwaneseThaiTlingit-HaidaTohono O'OdhamTonganTrinidadian and TobagonianTsimshianTurkishU.S. Virgin IslanderUkrainianUruguayanUteVenezuelanVietnameseWelshWest IndianYakamaYaquiYugoslavianYumanYup'ikZimbabwean
Immigration
NonimmigrantsImmigrantsAfghanistanAfricaAlbaniaArgentinaArmeniaAsiaAustraliaAustriaBahamasBangladeshBarbadosBelarusBelgiumBelizeBoliviaBosnia and HerzegovinaBrazilBulgariaBurma/MyanmarCabo VerdeCambodiaCameroonCanadaCaribbeanCentral AmericaChileChinaColombiaCongoCosta RicaCroatiaCubaCzechoslovakiaDenmarkDominicaDominican RepublicEastern AfricaEastern AsiaEastern EuropeEcuadorEgyptEl SalvadorEnglandEritreaEthiopiaEuropeFijiFranceGermanyGhanaGreeceGrenadaGuatemalaGuyanaHaitiHondurasHong KongHungaryIndiaIndonesiaIranIraqIrelandIsraelItalyJamaicaJapanJordanKazakhstanKenyaKoreaKuwaitLaosLatin AmericaLatviaLebanonLiberiaLithuaniaMalaysiaMexicoMicronesiaMiddle AfricaMoldovaMoroccoNepalNetherlandsNicaraguaNigeriaNorth AmericaNorth MacedoniaNorthern AfricaNorthern EuropeNorwayOceaniaPakistanPanamaPeruPhilippinesPolandPortugalRomaniaRussiaSaudi ArabiaScotlandSenegalSerbiaSierra LeoneSingaporeSomaliaSouth AfricaSouth AmericaSouth Central AsiaSouth Eastern AsiaSouthern EuropeSpainSri LankaSt. Vincent and the GrenadinesSudanSwedenSwitzerlandSyriaTaiwanThailandTrinidad and TobagoTurkeyUgandaUkraineUruguayUzbekistanVenezuelaVietnamWest IndiesWestern AfricaWestern AsiaWestern EuropeYemenZaireZimbabweAzores
Ugandan
Race
Ancestry
AfghanAfricanAlaska NativeAlaskan AthabascanAlbanianAleutAlsatianAmericanApacheArabArapahoArgentineanArmenianAssyrian/Chaldean/SyriacAustralianAustrianBahamianBangladeshiBarbadianBasqueBelgianBelizeanBermudanBhutaneseBlackfeetBolivianBrazilianBritishBritish West IndianBulgarianBurmeseCajunCambodianCanadianCape VerdeanCarpatho RusynCelticCentral AmericanCentral American IndianCherokeeCheyenneChickasawChileanChineseChippewaChoctawColombianColvilleComancheCosta RicanCreeCreekCroatianCrowCubanCypriotCzechDanishDelawareDominicanDutchDutch West IndianEastern EuropeanEcuadorianEgyptianEnglishEstonianEthiopianEuropeanFijianFilipinoFinnishFrenchFrench American IndianFrench CanadianGermanGerman RussianGhanaianGreekGuamanian/ChamorroGuatemalanGuyaneseHaitianHmongHonduranHopiHoumaHungarianIcelanderIndian (Asian)IndonesianInupiatIranianIraqiIrishIroquoisIsraeliItalianJamaicanJapaneseJordanianKenyanKiowaKoreanLaotianLatvianLebaneseLiberianLithuanianLumbeeLuxembourgerMacedonianMalaysianMalteseMarshalleseMenomineeMexicanMexican American IndianMongolianMoroccanNative HawaiianNavajoNepaleseNew ZealanderNicaraguanNigerianNorthern EuropeanNorwegianOkinawanOsageOttawaPaiutePakistaniPalestinianPanamanianParaguayanPennsylvania GermanPeruvianPimaPolishPortuguesePotawatomiPuebloPuerto RicanPuget Sound SalishRomanianRussianSalvadoranSamoanScandinavianScotch-IrishScottishSeminoleSenegaleseSerbianShoshoneSierra LeoneanSiouxSlavicSlovakSloveneSomaliSouth AfricanSouth AmericanSouth American IndianSoviet UnionSpaniardSpanishSpanish AmericanSpanish American IndianSri LankanSubsaharan AfricanSudaneseSwedishSwissSyrianTaiwaneseThaiTlingit-HaidaTohono O'OdhamTonganTrinidadian and TobagonianTsimshianTurkishU.S. Virgin IslanderUgandanUkrainianUruguayanUteVenezuelanVietnameseWelshWest IndianYakamaYaquiYugoslavianYumanYup'ikZimbabwean
Immigration
NonimmigrantsImmigrantsAfghanistanAfricaAlbaniaArgentinaArmeniaAsiaAustraliaAustriaBahamasBangladeshBarbadosBelarusBelgiumBelizeBoliviaBosnia and HerzegovinaBrazilBulgariaBurma/MyanmarCabo VerdeCambodiaCameroonCanadaCaribbeanCentral AmericaChileChinaColombiaCongoCosta RicaCroatiaCubaCzechoslovakiaDenmarkDominicaDominican RepublicEastern AfricaEastern AsiaEastern EuropeEcuadorEgyptEl SalvadorEnglandEritreaEthiopiaEuropeFijiFranceGermanyGhanaGreeceGrenadaGuatemalaGuyanaHaitiHondurasHong KongHungaryIndiaIndonesiaIranIraqIrelandIsraelItalyJamaicaJapanJordanKazakhstanKenyaKoreaKuwaitLaosLatin AmericaLatviaLebanonLiberiaLithuaniaMalaysiaMexicoMicronesiaMiddle AfricaMoldovaMoroccoNepalNetherlandsNicaraguaNigeriaNorth AmericaNorth MacedoniaNorthern AfricaNorthern EuropeNorwayOceaniaPakistanPanamaPeruPhilippinesPolandPortugalRomaniaRussiaSaudi ArabiaScotlandSenegalSerbiaSierra LeoneSingaporeSomaliaSouth AfricaSouth AmericaSouth Central AsiaSouth Eastern AsiaSouthern EuropeSpainSri LankaSt. Vincent and the GrenadinesSudanSwedenSwitzerlandSyriaTaiwanThailandTrinidad and TobagoTurkeyUgandaUkraineUruguayUzbekistanVenezuelaVietnamWest IndiesWestern AfricaWestern AsiaWestern EuropeYemenZaireZimbabweAzores
Family Households
Income
Poverty
Unemployment
Labor Participation
Family Structure
Vehicle Availability
Education Level
Disability

Family Households Comparison

Czechoslovakians

Ugandans

Excellent
Tragic
64.6%
FAMILY HOUSEHOLDS
82.1/ 100
METRIC RATING
143rd/ 347
METRIC RANK
61.7%
FAMILY HOUSEHOLDS
0.0/ 100
METRIC RATING
320th/ 347
METRIC RANK

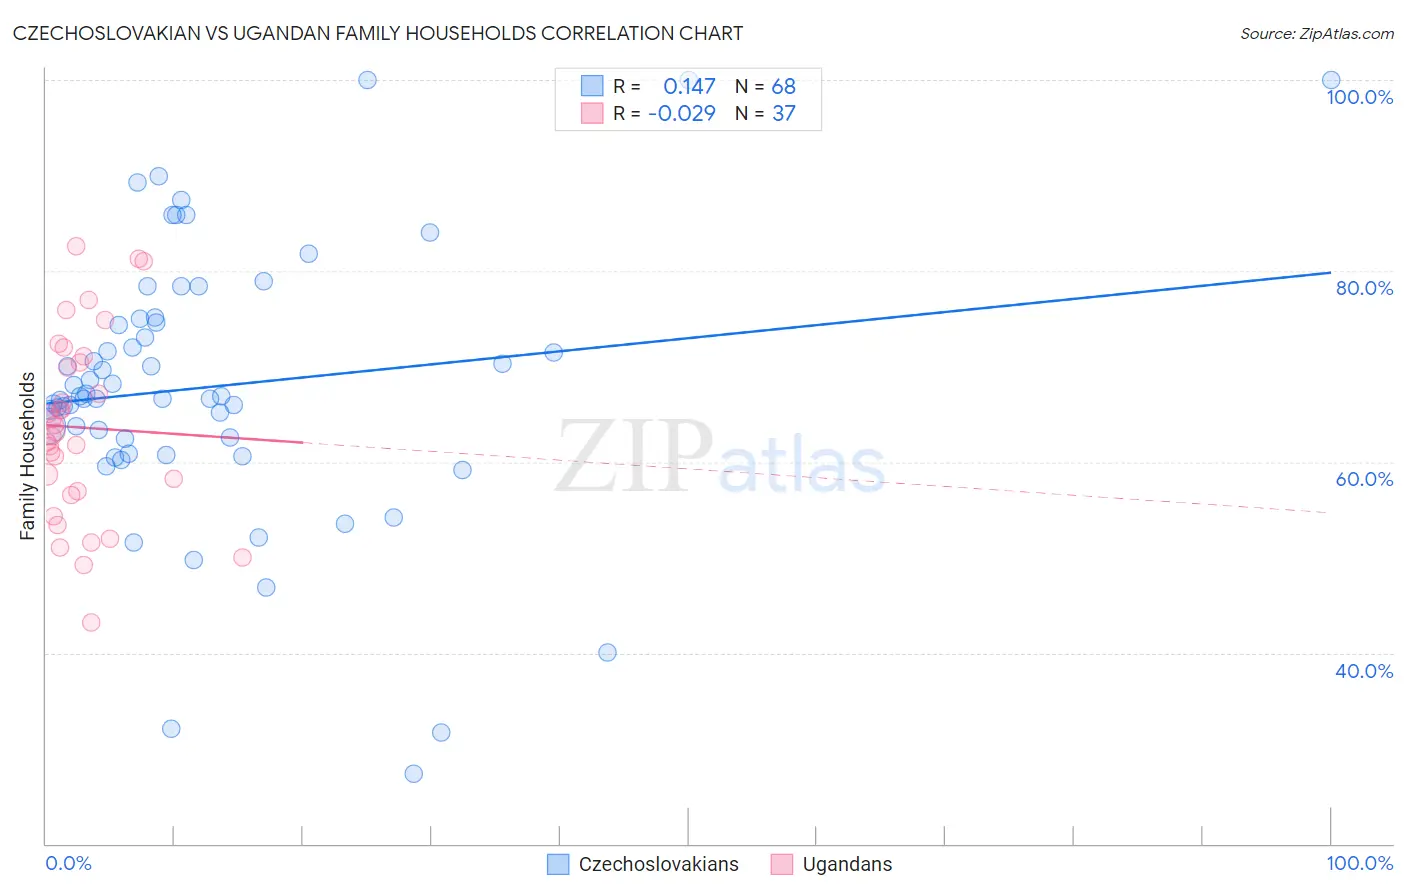
Czechoslovakian vs Ugandan Family Households Correlation Chart

The statistical analysis conducted on geographies consisting of 368,525,502 people shows a poor positive correlation between the proportion of Czechoslovakians and percentage of family households in the United States with a correlation coefficient (R) of 0.147 and weighted average of 64.6%. Similarly, the statistical analysis conducted on geographies consisting of 93,998,948 people shows no correlation between the proportion of Ugandans and percentage of family households in the United States with a correlation coefficient (R) of -0.029 and weighted average of 61.7%, a difference of 4.7%.
Czechoslovakian vs Ugandan Family Households

Family Households Correlation Summary

MeasurementCzechoslovakianUgandan
Minimum27.4%43.1%
Maximum100.0%82.6%
Range72.6%39.5%
Mean67.9%63.6%
Median66.7%63.1%
Interquartile 25% (IQ1)61.6%56.7%
Interquartile 75% (IQ3)74.8%70.8%
Interquartile Range (IQR)13.1%14.1%
Standard Deviation (Sample)14.4%9.7%
Standard Deviation (Population)14.3%9.5%

Similar Demographics by Family Households

Demographics Similar to Czechoslovakians by Family Households

In terms of family households, the demographic groups most similar to Czechoslovakians are South American Indian (64.6%, a difference of 0.0%), Welsh (64.6%, a difference of 0.040%), Pakistani (64.7%, a difference of 0.050%), Immigrants from North Macedonia (64.7%, a difference of 0.070%), and Immigrants from Cameroon (64.7%, a difference of 0.070%).
DemographicsRating | RankFamily Households
Immigrants | China
86.6
/100
|
#136
Excellent
64.7%
Immigrants | Scotland
86.4
/100
|
#137
Excellent
64.7%
Basques
85.5
/100
|
#138
Excellent
64.7%
Immigrants | Jamaica
85.3
/100
|
#139
Excellent
64.7%
Immigrants | North Macedonia
84.9
/100
|
#140
Excellent
64.7%
Immigrants | Cameroon
84.8
/100
|
#141
Excellent
64.7%
Pakistanis
84.0
/100
|
#142
Excellent
64.7%
Czechoslovakians
82.1
/100
|
#143
Excellent
64.6%
South American Indians
81.9
/100
|
#144
Excellent
64.6%
Welsh
80.1
/100
|
#145
Excellent
64.6%
Immigrants | Romania
77.0
/100
|
#146
Good
64.6%
Immigrants | Chile
76.5
/100
|
#147
Good
64.6%
Delaware
76.3
/100
|
#148
Good
64.6%
Sioux
76.3
/100
|
#149
Good
64.6%
Romanians
75.3
/100
|
#150
Good
64.5%

Demographics Similar to Ugandans by Family Households

In terms of family households, the demographic groups most similar to Ugandans are Alsatian (61.7%, a difference of 0.050%), Cape Verdean (61.8%, a difference of 0.12%), Immigrants from Serbia (61.6%, a difference of 0.14%), Tlingit-Haida (61.6%, a difference of 0.15%), and Immigrants from West Indies (61.6%, a difference of 0.16%).
DemographicsRating | RankFamily Households
Liberians
0.0
/100
|
#313
Tragic
62.0%
Immigrants | Cabo Verde
0.0
/100
|
#314
Tragic
61.9%
Moroccans
0.0
/100
|
#315
Tragic
61.9%
Immigrants | Middle Africa
0.0
/100
|
#316
Tragic
61.9%
Immigrants | Bosnia and Herzegovina
0.0
/100
|
#317
Tragic
61.9%
Alaskan Athabascans
0.0
/100
|
#318
Tragic
61.8%
Cape Verdeans
0.0
/100
|
#319
Tragic
61.8%
Ugandans
0.0
/100
|
#320
Tragic
61.7%
Alsatians
0.0
/100
|
#321
Tragic
61.7%
Immigrants | Serbia
0.0
/100
|
#322
Tragic
61.6%
Tlingit-Haida
0.0
/100
|
#323
Tragic
61.6%
Immigrants | West Indies
0.0
/100
|
#324
Tragic
61.6%
Immigrants | Switzerland
0.0
/100
|
#325
Tragic
61.6%
Indonesians
0.0
/100
|
#326
Tragic
61.5%
Blacks/African Americans
0.0
/100
|
#327
Tragic
61.5%