Macedonian vs Immigrants from Ethiopia Family Households
COMPARE
Macedonian
Immigrants from Ethiopia
Family Households
Family Households Comparison
Macedonians
Immigrants from Ethiopia
63.7%
FAMILY HOUSEHOLDS
6.5/ 100
METRIC RATING
219th/ 347
METRIC RANK
61.2%
FAMILY HOUSEHOLDS
0.0/ 100
METRIC RATING
333rd/ 347
METRIC RANK
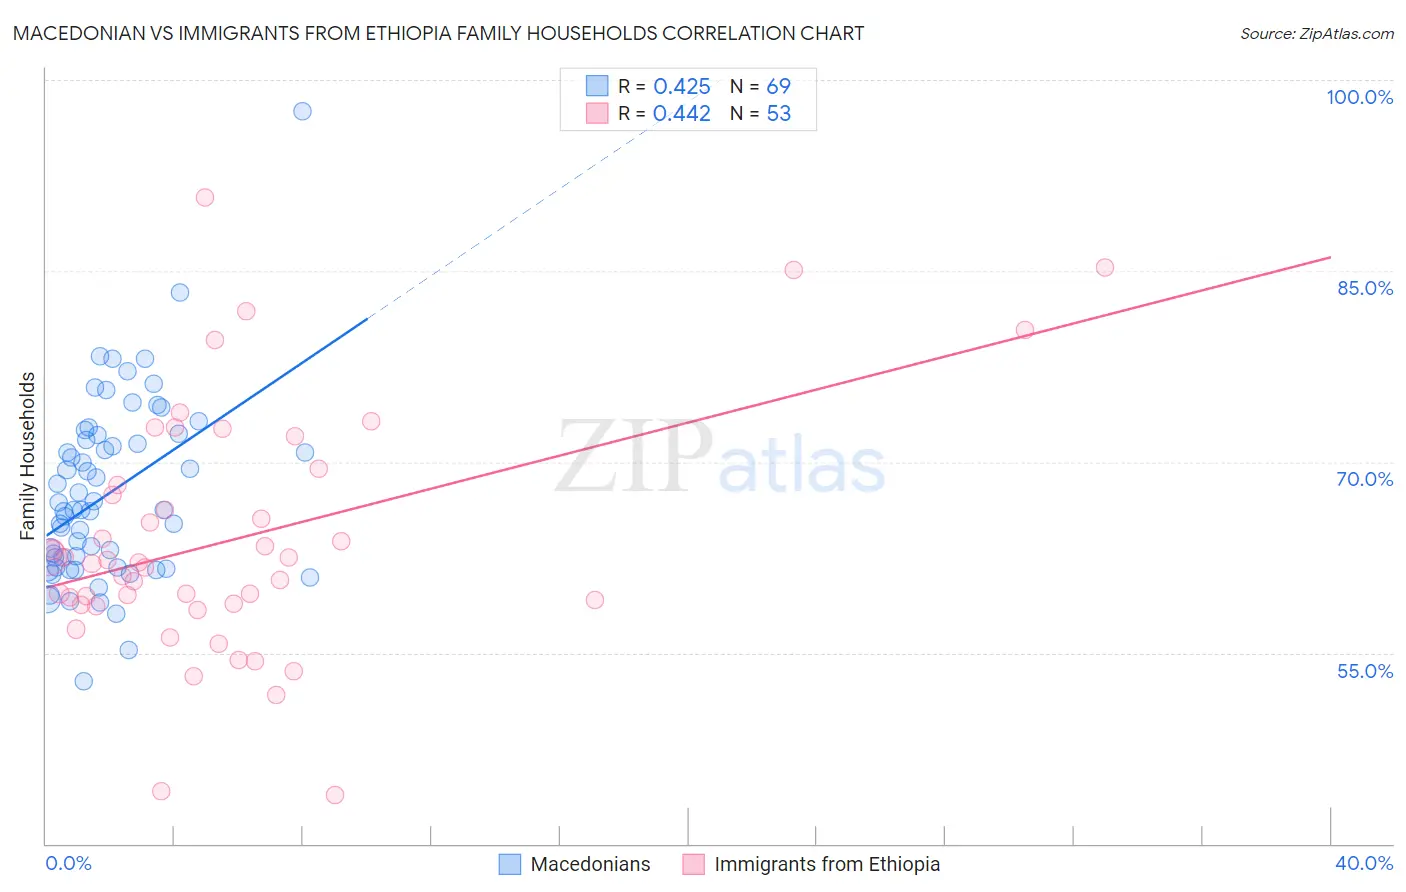
Macedonian vs Immigrants from Ethiopia Family Households Correlation Chart
The statistical analysis conducted on geographies consisting of 132,622,141 people shows a moderate positive correlation between the proportion of Macedonians and percentage of family households in the United States with a correlation coefficient (R) of 0.425 and weighted average of 63.7%. Similarly, the statistical analysis conducted on geographies consisting of 211,469,180 people shows a moderate positive correlation between the proportion of Immigrants from Ethiopia and percentage of family households in the United States with a correlation coefficient (R) of 0.442 and weighted average of 61.2%, a difference of 4.1%.
Family Households Correlation Summary
| Measurement | Macedonian | Immigrants from Ethiopia |
| Minimum | 52.7% | 43.8% |
| Maximum | 97.6% | 90.8% |
| Range | 44.8% | 47.0% |
| Mean | 67.5% | 63.9% |
| Median | 66.2% | 62.1% |
| Interquartile 25% (IQ1) | 61.7% | 58.8% |
| Interquartile 75% (IQ3) | 72.0% | 68.8% |
| Interquartile Range (IQR) | 10.2% | 10.0% |
| Standard Deviation (Sample) | 7.2% | 9.6% |
| Standard Deviation (Population) | 7.2% | 9.6% |
Similar Demographics by Family Households
Demographics Similar to Macedonians by Family Households
In terms of family households, the demographic groups most similar to Macedonians are Immigrants from Europe (63.7%, a difference of 0.010%), Osage (63.7%, a difference of 0.030%), Marshallese (63.7%, a difference of 0.030%), Immigrants from South Africa (63.7%, a difference of 0.030%), and Croatian (63.8%, a difference of 0.040%).
| Demographics | Rating | Rank | Family Households |
| Immigrants | Netherlands | 9.4 /100 | #212 | Tragic 63.8% |
| Immigrants | Northern Europe | 8.8 /100 | #213 | Tragic 63.8% |
| Celtics | 8.0 /100 | #214 | Tragic 63.8% |
| Belgians | 7.6 /100 | #215 | Tragic 63.8% |
| Croatians | 7.3 /100 | #216 | Tragic 63.8% |
| Osage | 7.0 /100 | #217 | Tragic 63.7% |
| Marshallese | 6.9 /100 | #218 | Tragic 63.7% |
| Macedonians | 6.5 /100 | #219 | Tragic 63.7% |
| Immigrants | Europe | 6.4 /100 | #220 | Tragic 63.7% |
| Immigrants | South Africa | 5.9 /100 | #221 | Tragic 63.7% |
| Immigrants | Belarus | 5.5 /100 | #222 | Tragic 63.7% |
| French Canadians | 5.4 /100 | #223 | Tragic 63.7% |
| Turks | 4.5 /100 | #224 | Tragic 63.6% |
| Immigrants | Hungary | 4.3 /100 | #225 | Tragic 63.6% |
| Immigrants | Bahamas | 4.2 /100 | #226 | Tragic 63.6% |
Demographics Similar to Immigrants from Ethiopia by Family Households
In terms of family households, the demographic groups most similar to Immigrants from Ethiopia are Ethiopian (61.2%, a difference of 0.080%), Immigrants from Eastern Africa (61.1%, a difference of 0.080%), Immigrants from Australia (61.3%, a difference of 0.16%), Immigrants from France (61.3%, a difference of 0.16%), and Carpatho Rusyn (61.1%, a difference of 0.20%).
| Demographics | Rating | Rank | Family Households |
| Indonesians | 0.0 /100 | #326 | Tragic 61.5% |
| Blacks/African Americans | 0.0 /100 | #327 | Tragic 61.5% |
| Kiowa | 0.0 /100 | #328 | Tragic 61.4% |
| Cambodians | 0.0 /100 | #329 | Tragic 61.4% |
| Immigrants | Australia | 0.0 /100 | #330 | Tragic 61.3% |
| Immigrants | France | 0.0 /100 | #331 | Tragic 61.3% |
| Ethiopians | 0.0 /100 | #332 | Tragic 61.2% |
| Immigrants | Ethiopia | 0.0 /100 | #333 | Tragic 61.2% |
| Immigrants | Eastern Africa | 0.0 /100 | #334 | Tragic 61.1% |
| Carpatho Rusyns | 0.0 /100 | #335 | Tragic 61.1% |
| German Russians | 0.0 /100 | #336 | Tragic 60.9% |
| Soviet Union | 0.0 /100 | #337 | Tragic 60.9% |
| Immigrants | Eritrea | 0.0 /100 | #338 | Tragic 60.8% |
| Immigrants | Saudi Arabia | 0.0 /100 | #339 | Tragic 60.7% |
| Immigrants | Sudan | 0.0 /100 | #340 | Tragic 60.2% |