White/Caucasian vs Ugandan Family Households
COMPARE
White/Caucasian
Ugandan
Family Households
Family Households Comparison
Whites/Caucasians
Ugandans
65.1%
FAMILY HOUSEHOLDS
97.3/ 100
METRIC RATING
106th/ 347
METRIC RANK
61.7%
FAMILY HOUSEHOLDS
0.0/ 100
METRIC RATING
320th/ 347
METRIC RANK
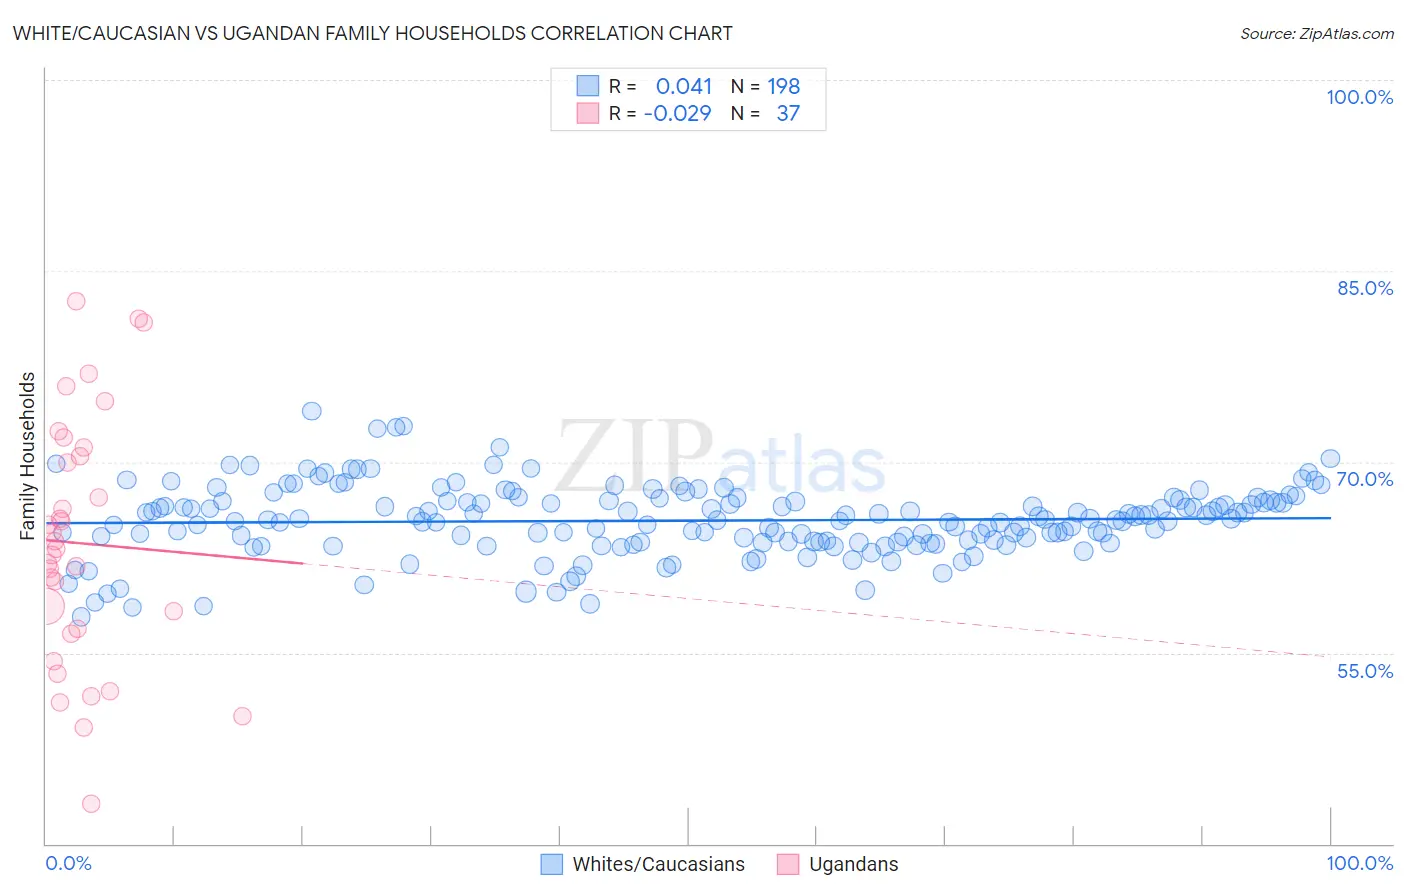
White/Caucasian vs Ugandan Family Households Correlation Chart
The statistical analysis conducted on geographies consisting of 583,404,085 people shows no correlation between the proportion of Whites/Caucasians and percentage of family households in the United States with a correlation coefficient (R) of 0.041 and weighted average of 65.1%. Similarly, the statistical analysis conducted on geographies consisting of 93,998,948 people shows no correlation between the proportion of Ugandans and percentage of family households in the United States with a correlation coefficient (R) of -0.029 and weighted average of 61.7%, a difference of 5.5%.
Family Households Correlation Summary
| Measurement | White/Caucasian | Ugandan |
| Minimum | 57.8% | 43.1% |
| Maximum | 73.9% | 82.6% |
| Range | 16.1% | 39.5% |
| Mean | 65.4% | 63.6% |
| Median | 65.4% | 63.1% |
| Interquartile 25% (IQ1) | 63.7% | 56.7% |
| Interquartile 75% (IQ3) | 66.9% | 70.8% |
| Interquartile Range (IQR) | 3.2% | 14.1% |
| Standard Deviation (Sample) | 2.8% | 9.7% |
| Standard Deviation (Population) | 2.8% | 9.5% |
Similar Demographics by Family Households
Demographics Similar to Whites/Caucasians by Family Households
In terms of family households, the demographic groups most similar to Whites/Caucasians are Alaska Native (65.1%, a difference of 0.0%), English (65.1%, a difference of 0.010%), Palestinian (65.1%, a difference of 0.010%), Immigrants from Guatemala (65.0%, a difference of 0.050%), and Scandinavian (65.0%, a difference of 0.060%).
| Demographics | Rating | Rank | Family Households |
| Central American Indians | 98.3 /100 | #99 | Exceptional 65.2% |
| Haitians | 98.1 /100 | #100 | Exceptional 65.2% |
| Chileans | 98.1 /100 | #101 | Exceptional 65.2% |
| Immigrants | Sri Lanka | 98.0 /100 | #102 | Exceptional 65.1% |
| Indians (Asian) | 97.9 /100 | #103 | Exceptional 65.1% |
| Spaniards | 97.8 /100 | #104 | Exceptional 65.1% |
| English | 97.4 /100 | #105 | Exceptional 65.1% |
| Whites/Caucasians | 97.3 /100 | #106 | Exceptional 65.1% |
| Alaska Natives | 97.3 /100 | #107 | Exceptional 65.1% |
| Palestinians | 97.2 /100 | #108 | Exceptional 65.1% |
| Immigrants | Guatemala | 96.9 /100 | #109 | Exceptional 65.0% |
| Scandinavians | 96.8 /100 | #110 | Exceptional 65.0% |
| Europeans | 96.8 /100 | #111 | Exceptional 65.0% |
| Immigrants | Jordan | 96.5 /100 | #112 | Exceptional 65.0% |
| Spanish | 96.2 /100 | #113 | Exceptional 65.0% |
Demographics Similar to Ugandans by Family Households
In terms of family households, the demographic groups most similar to Ugandans are Alsatian (61.7%, a difference of 0.050%), Cape Verdean (61.8%, a difference of 0.12%), Immigrants from Serbia (61.6%, a difference of 0.14%), Tlingit-Haida (61.6%, a difference of 0.15%), and Immigrants from West Indies (61.6%, a difference of 0.16%).
| Demographics | Rating | Rank | Family Households |
| Liberians | 0.0 /100 | #313 | Tragic 62.0% |
| Immigrants | Cabo Verde | 0.0 /100 | #314 | Tragic 61.9% |
| Moroccans | 0.0 /100 | #315 | Tragic 61.9% |
| Immigrants | Middle Africa | 0.0 /100 | #316 | Tragic 61.9% |
| Immigrants | Bosnia and Herzegovina | 0.0 /100 | #317 | Tragic 61.9% |
| Alaskan Athabascans | 0.0 /100 | #318 | Tragic 61.8% |
| Cape Verdeans | 0.0 /100 | #319 | Tragic 61.8% |
| Ugandans | 0.0 /100 | #320 | Tragic 61.7% |
| Alsatians | 0.0 /100 | #321 | Tragic 61.7% |
| Immigrants | Serbia | 0.0 /100 | #322 | Tragic 61.6% |
| Tlingit-Haida | 0.0 /100 | #323 | Tragic 61.6% |
| Immigrants | West Indies | 0.0 /100 | #324 | Tragic 61.6% |
| Immigrants | Switzerland | 0.0 /100 | #325 | Tragic 61.6% |
| Indonesians | 0.0 /100 | #326 | Tragic 61.5% |
| Blacks/African Americans | 0.0 /100 | #327 | Tragic 61.5% |