Macedonian vs Ugandan Doctorate Degree
COMPARE
Macedonian
Ugandan
Doctorate Degree
Doctorate Degree Comparison
Macedonians
Ugandans
1.9%
DOCTORATE DEGREE
60.9/ 100
METRIC RATING
167th/ 347
METRIC RANK
2.2%
DOCTORATE DEGREE
99.7/ 100
METRIC RATING
80th/ 347
METRIC RANK
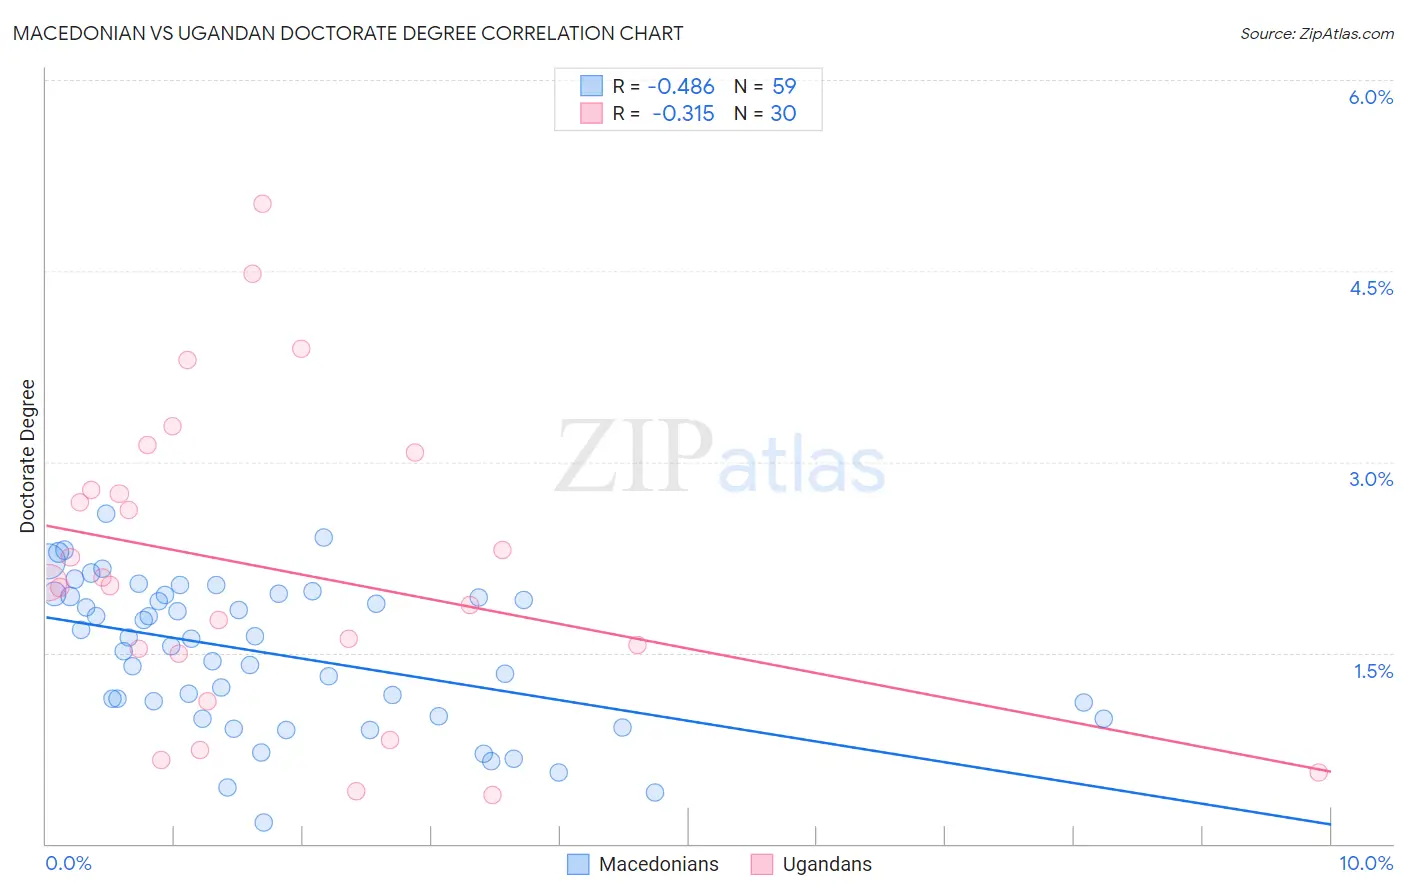
Macedonian vs Ugandan Doctorate Degree Correlation Chart
The statistical analysis conducted on geographies consisting of 132,009,126 people shows a moderate negative correlation between the proportion of Macedonians and percentage of population with at least doctorate degree education in the United States with a correlation coefficient (R) of -0.486 and weighted average of 1.9%. Similarly, the statistical analysis conducted on geographies consisting of 93,908,967 people shows a mild negative correlation between the proportion of Ugandans and percentage of population with at least doctorate degree education in the United States with a correlation coefficient (R) of -0.315 and weighted average of 2.2%, a difference of 19.1%.
Doctorate Degree Correlation Summary
| Measurement | Macedonian | Ugandan |
| Minimum | 0.17% | 0.38% |
| Maximum | 2.6% | 5.0% |
| Range | 2.4% | 4.6% |
| Mean | 1.5% | 2.2% |
| Median | 1.6% | 2.0% |
| Interquartile 25% (IQ1) | 1.0% | 1.5% |
| Interquartile 75% (IQ3) | 2.0% | 2.8% |
| Interquartile Range (IQR) | 0.95% | 1.3% |
| Standard Deviation (Sample) | 0.57% | 1.2% |
| Standard Deviation (Population) | 0.57% | 1.2% |
Similar Demographics by Doctorate Degree
Demographics Similar to Macedonians by Doctorate Degree
In terms of doctorate degree, the demographic groups most similar to Macedonians are Sri Lankan (1.9%, a difference of 0.10%), Spaniard (1.9%, a difference of 0.39%), Scotch-Irish (1.9%, a difference of 0.41%), Celtic (1.9%, a difference of 0.90%), and Vietnamese (1.9%, a difference of 0.92%).
| Demographics | Rating | Rank | Doctorate Degree |
| Welsh | 69.7 /100 | #160 | Good 1.9% |
| Immigrants | Middle Africa | 68.8 /100 | #161 | Good 1.9% |
| Irish | 67.5 /100 | #162 | Good 1.9% |
| Czechs | 67.3 /100 | #163 | Good 1.9% |
| Celtics | 66.7 /100 | #164 | Good 1.9% |
| Scotch-Irish | 63.6 /100 | #165 | Good 1.9% |
| Spaniards | 63.5 /100 | #166 | Good 1.9% |
| Macedonians | 60.9 /100 | #167 | Good 1.9% |
| Sri Lankans | 60.3 /100 | #168 | Good 1.9% |
| Vietnamese | 54.8 /100 | #169 | Average 1.9% |
| Costa Ricans | 53.3 /100 | #170 | Average 1.8% |
| Bermudans | 52.1 /100 | #171 | Average 1.8% |
| Belgians | 50.3 /100 | #172 | Average 1.8% |
| Norwegians | 50.0 /100 | #173 | Average 1.8% |
| Immigrants | Bangladesh | 50.0 /100 | #174 | Average 1.8% |
Demographics Similar to Ugandans by Doctorate Degree
In terms of doctorate degree, the demographic groups most similar to Ugandans are Immigrants from Argentina (2.2%, a difference of 0.050%), Northern European (2.2%, a difference of 0.28%), Immigrants from Belarus (2.2%, a difference of 0.35%), Immigrants from Uganda (2.2%, a difference of 0.59%), and Immigrants from Lithuania (2.2%, a difference of 0.77%).
| Demographics | Rating | Rank | Doctorate Degree |
| Immigrants | Bulgaria | 99.8 /100 | #73 | Exceptional 2.3% |
| Immigrants | North America | 99.8 /100 | #74 | Exceptional 2.2% |
| Immigrants | Western Asia | 99.8 /100 | #75 | Exceptional 2.2% |
| Immigrants | Hungary | 99.8 /100 | #76 | Exceptional 2.2% |
| Immigrants | Lebanon | 99.8 /100 | #77 | Exceptional 2.2% |
| Immigrants | Belarus | 99.7 /100 | #78 | Exceptional 2.2% |
| Northern Europeans | 99.7 /100 | #79 | Exceptional 2.2% |
| Ugandans | 99.7 /100 | #80 | Exceptional 2.2% |
| Immigrants | Argentina | 99.7 /100 | #81 | Exceptional 2.2% |
| Immigrants | Uganda | 99.6 /100 | #82 | Exceptional 2.2% |
| Immigrants | Lithuania | 99.6 /100 | #83 | Exceptional 2.2% |
| Immigrants | England | 99.6 /100 | #84 | Exceptional 2.2% |
| Immigrants | Brazil | 99.6 /100 | #85 | Exceptional 2.2% |
| Egyptians | 99.4 /100 | #86 | Exceptional 2.2% |
| Immigrants | Zimbabwe | 99.4 /100 | #87 | Exceptional 2.2% |