Luxembourger vs Immigrants from Denmark Average Family Size
COMPARE
Luxembourger
Immigrants from Denmark
Average Family Size
Average Family Size Comparison
Luxembourgers
Immigrants from Denmark
3.10
AVERAGE FAMILY SIZE
0.0/ 100
METRIC RATING
335th/ 347
METRIC RANK
3.15
AVERAGE FAMILY SIZE
0.4/ 100
METRIC RATING
281st/ 347
METRIC RANK
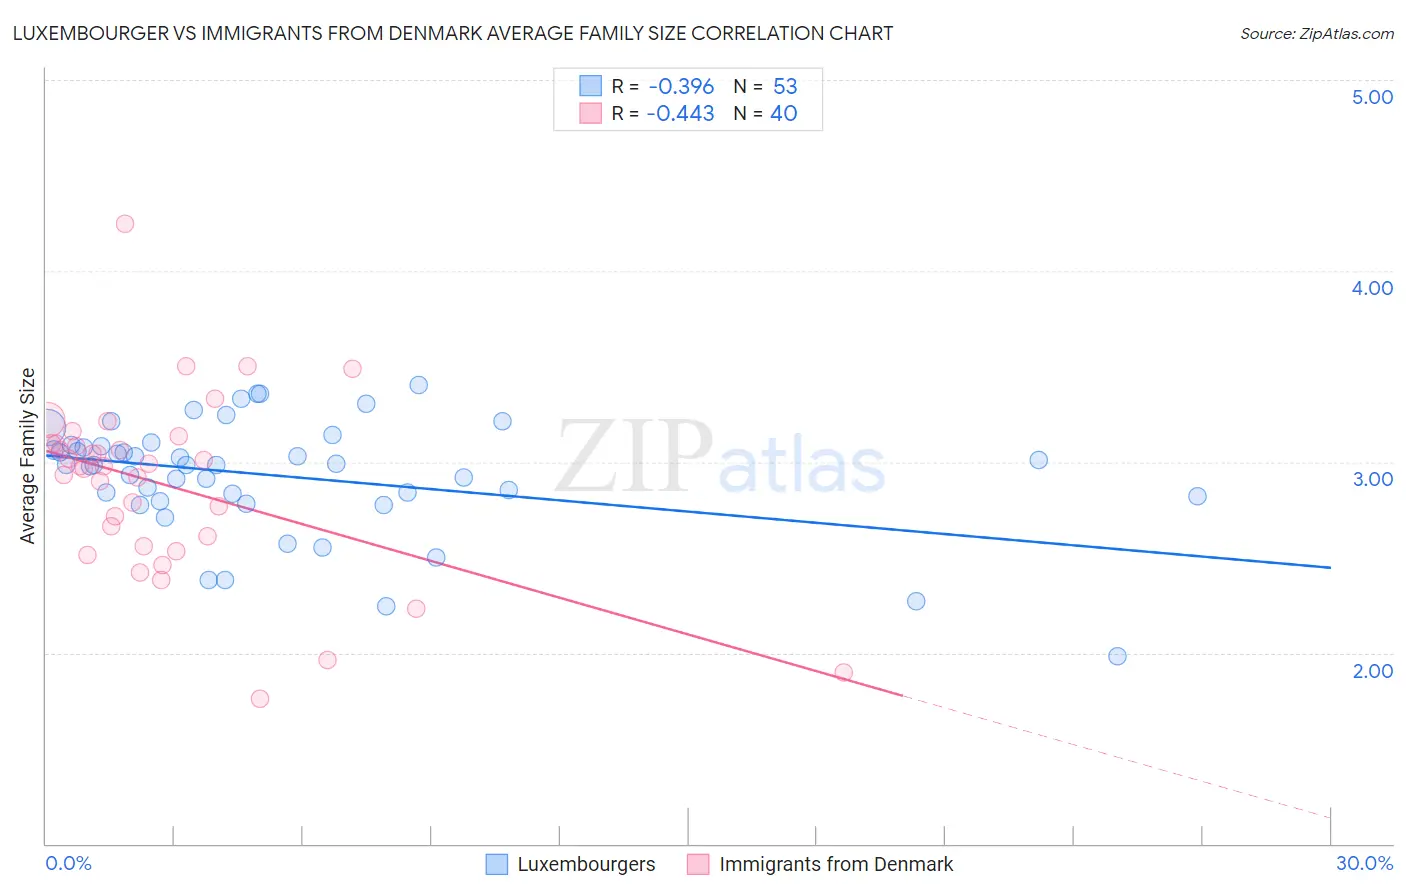
Luxembourger vs Immigrants from Denmark Average Family Size Correlation Chart
The statistical analysis conducted on geographies consisting of 144,654,567 people shows a mild negative correlation between the proportion of Luxembourgers and average family size in the United States with a correlation coefficient (R) of -0.396 and weighted average of 3.10. Similarly, the statistical analysis conducted on geographies consisting of 136,403,907 people shows a moderate negative correlation between the proportion of Immigrants from Denmark and average family size in the United States with a correlation coefficient (R) of -0.443 and weighted average of 3.15, a difference of 1.4%.
Average Family Size Correlation Summary
| Measurement | Luxembourger | Immigrants from Denmark |
| Minimum | 1.98 | 1.76 |
| Maximum | 3.40 | 4.25 |
| Range | 1.42 | 2.49 |
| Mean | 2.92 | 2.88 |
| Median | 2.98 | 2.98 |
| Interquartile 25% (IQ1) | 2.81 | 2.58 |
| Interquartile 75% (IQ3) | 3.09 | 3.10 |
| Interquartile Range (IQR) | 0.28 | 0.51 |
| Standard Deviation (Sample) | 0.30 | 0.47 |
| Standard Deviation (Population) | 0.30 | 0.46 |
Similar Demographics by Average Family Size
Demographics Similar to Luxembourgers by Average Family Size
In terms of average family size, the demographic groups most similar to Luxembourgers are Estonian (3.10, a difference of 0.030%), Lithuanian (3.10, a difference of 0.030%), Irish (3.10, a difference of 0.060%), Scotch-Irish (3.11, a difference of 0.080%), and Scottish (3.11, a difference of 0.080%).
| Demographics | Rating | Rank | Average Family Size |
| Czechs | 0.0 /100 | #328 | Tragic 3.11 |
| Belgians | 0.0 /100 | #329 | Tragic 3.11 |
| Latvians | 0.0 /100 | #330 | Tragic 3.11 |
| Scotch-Irish | 0.0 /100 | #331 | Tragic 3.11 |
| Scottish | 0.0 /100 | #332 | Tragic 3.11 |
| Estonians | 0.0 /100 | #333 | Tragic 3.10 |
| Lithuanians | 0.0 /100 | #334 | Tragic 3.10 |
| Luxembourgers | 0.0 /100 | #335 | Tragic 3.10 |
| Irish | 0.0 /100 | #336 | Tragic 3.10 |
| Swedes | 0.0 /100 | #337 | Tragic 3.10 |
| French | 0.0 /100 | #338 | Tragic 3.10 |
| Croatians | 0.0 /100 | #339 | Tragic 3.10 |
| Finns | 0.0 /100 | #340 | Tragic 3.09 |
| Poles | 0.0 /100 | #341 | Tragic 3.09 |
| Germans | 0.0 /100 | #342 | Tragic 3.09 |
Demographics Similar to Immigrants from Denmark by Average Family Size
In terms of average family size, the demographic groups most similar to Immigrants from Denmark are Yugoslavian (3.15, a difference of 0.010%), German Russian (3.15, a difference of 0.020%), Immigrants from England (3.15, a difference of 0.040%), Immigrants from France (3.15, a difference of 0.040%), and Immigrants from Europe (3.15, a difference of 0.060%).
| Demographics | Rating | Rank | Average Family Size |
| Immigrants | Belgium | 0.6 /100 | #274 | Tragic 3.15 |
| Cambodians | 0.6 /100 | #275 | Tragic 3.15 |
| Immigrants | Bosnia and Herzegovina | 0.5 /100 | #276 | Tragic 3.15 |
| Swiss | 0.5 /100 | #277 | Tragic 3.15 |
| Okinawans | 0.5 /100 | #278 | Tragic 3.15 |
| Immigrants | Europe | 0.5 /100 | #279 | Tragic 3.15 |
| Immigrants | England | 0.4 /100 | #280 | Tragic 3.15 |
| Immigrants | Denmark | 0.4 /100 | #281 | Tragic 3.15 |
| Yugoslavians | 0.4 /100 | #282 | Tragic 3.15 |
| German Russians | 0.4 /100 | #283 | Tragic 3.15 |
| Immigrants | France | 0.4 /100 | #284 | Tragic 3.15 |
| Whites/Caucasians | 0.3 /100 | #285 | Tragic 3.14 |
| Immigrants | Netherlands | 0.3 /100 | #286 | Tragic 3.14 |
| Greeks | 0.3 /100 | #287 | Tragic 3.14 |
| Immigrants | Czechoslovakia | 0.3 /100 | #288 | Tragic 3.14 |