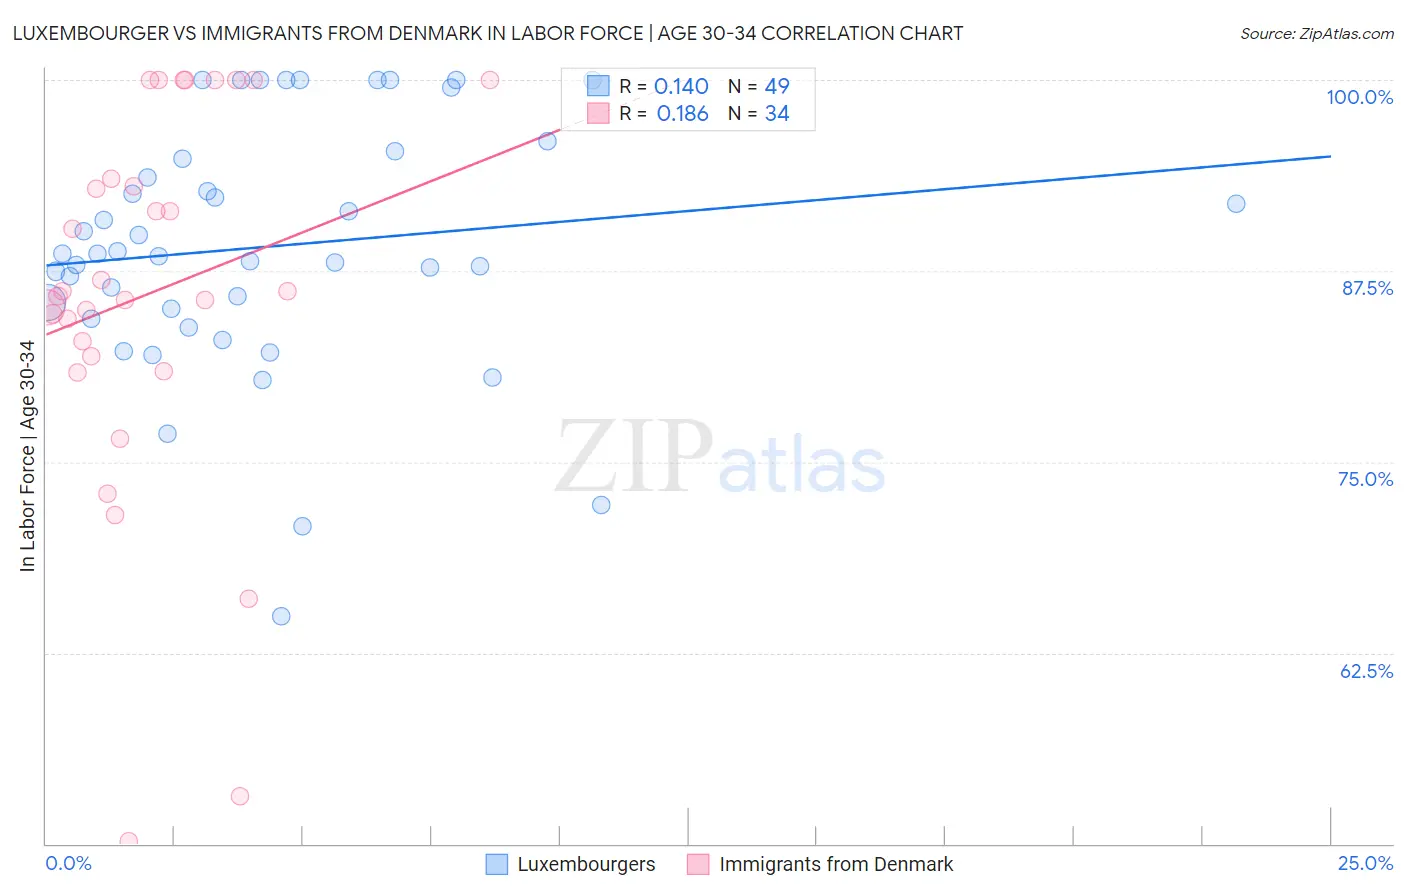
Luxembourger vs Immigrants from Denmark In Labor Force | Age 30-34
COMPARE
Luxembourger
Immigrants from Denmark
In Labor Force | Age 30-34
In Labor Force | Age 30-34 Comparison
Luxembourgers
Immigrants from Denmark
86.6%
IN LABOR FORCE | AGE 30-34
100.0/ 100
METRIC RATING
1st/ 347
METRIC RANK
85.1%
IN LABOR FORCE | AGE 30-34
94.3/ 100
METRIC RATING
117th/ 347
METRIC RANK
Luxembourger vs Immigrants from Denmark In Labor Force | Age 30-34 Correlation Chart
The statistical analysis conducted on geographies consisting of 144,656,260 people shows a poor positive correlation between the proportion of Luxembourgers and labor force participation rate among population between the ages 30 and 34 in the United States with a correlation coefficient (R) of 0.140 and weighted average of 86.6%. Similarly, the statistical analysis conducted on geographies consisting of 136,406,477 people shows a poor positive correlation between the proportion of Immigrants from Denmark and labor force participation rate among population between the ages 30 and 34 in the United States with a correlation coefficient (R) of 0.186 and weighted average of 85.1%, a difference of 1.8%.
In Labor Force | Age 30-34 Correlation Summary
| Measurement | Luxembourger | Immigrants from Denmark |
| Minimum | 64.9% | 50.2% |
| Maximum | 100.0% | 100.0% |
| Range | 35.1% | 49.8% |
| Mean | 89.1% | 86.0% |
| Median | 88.6% | 86.0% |
| Interquartile 25% (IQ1) | 84.7% | 81.9% |
| Interquartile 75% (IQ3) | 95.1% | 93.5% |
| Interquartile Range (IQR) | 10.4% | 11.6% |
| Standard Deviation (Sample) | 8.1% | 12.5% |
| Standard Deviation (Population) | 8.0% | 12.3% |
Similar Demographics by In Labor Force | Age 30-34
Demographics Similar to Luxembourgers by In Labor Force | Age 30-34
In terms of in labor force | age 30-34, the demographic groups most similar to Luxembourgers are Ethiopian (86.6%, a difference of 0.070%), Immigrants from Ethiopia (86.6%, a difference of 0.080%), Liberian (86.4%, a difference of 0.28%), Immigrants from Ireland (86.3%, a difference of 0.42%), and Somali (86.2%, a difference of 0.45%).
| Demographics | Rating | Rank | In Labor Force | Age 30-34 |
| Luxembourgers | 100.0 /100 | #1 | Exceptional 86.6% |
| Ethiopians | 100.0 /100 | #2 | Exceptional 86.6% |
| Immigrants | Ethiopia | 100.0 /100 | #3 | Exceptional 86.6% |
| Liberians | 100.0 /100 | #4 | Exceptional 86.4% |
| Immigrants | Ireland | 100.0 /100 | #5 | Exceptional 86.3% |
| Somalis | 100.0 /100 | #6 | Exceptional 86.2% |
| Immigrants | Bolivia | 100.0 /100 | #7 | Exceptional 86.2% |
| Cambodians | 100.0 /100 | #8 | Exceptional 86.2% |
| Immigrants | Somalia | 100.0 /100 | #9 | Exceptional 86.2% |
| Immigrants | Serbia | 100.0 /100 | #10 | Exceptional 86.2% |
| Carpatho Rusyns | 100.0 /100 | #11 | Exceptional 86.2% |
| Bolivians | 100.0 /100 | #12 | Exceptional 86.1% |
| Immigrants | Croatia | 100.0 /100 | #13 | Exceptional 86.1% |
| Immigrants | Cabo Verde | 100.0 /100 | #14 | Exceptional 86.1% |
| Immigrants | Albania | 100.0 /100 | #15 | Exceptional 86.1% |
Demographics Similar to Immigrants from Denmark by In Labor Force | Age 30-34
In terms of in labor force | age 30-34, the demographic groups most similar to Immigrants from Denmark are Immigrants from Malaysia (85.1%, a difference of 0.0%), Immigrants from Romania (85.1%, a difference of 0.010%), Yugoslavian (85.1%, a difference of 0.010%), Immigrants from South Central Asia (85.1%, a difference of 0.010%), and Egyptian (85.1%, a difference of 0.010%).
| Demographics | Rating | Rank | In Labor Force | Age 30-34 |
| Immigrants | South Africa | 95.3 /100 | #110 | Exceptional 85.1% |
| Immigrants | Scotland | 94.9 /100 | #111 | Exceptional 85.1% |
| Immigrants | Hungary | 94.8 /100 | #112 | Exceptional 85.1% |
| Immigrants | Romania | 94.7 /100 | #113 | Exceptional 85.1% |
| Yugoslavians | 94.7 /100 | #114 | Exceptional 85.1% |
| Immigrants | South Central Asia | 94.6 /100 | #115 | Exceptional 85.1% |
| Egyptians | 94.5 /100 | #116 | Exceptional 85.1% |
| Immigrants | Denmark | 94.3 /100 | #117 | Exceptional 85.1% |
| Immigrants | Malaysia | 94.2 /100 | #118 | Exceptional 85.1% |
| Asians | 93.4 /100 | #119 | Exceptional 85.1% |
| Immigrants | Southern Europe | 93.3 /100 | #120 | Exceptional 85.1% |
| Immigrants | Egypt | 93.2 /100 | #121 | Exceptional 85.1% |
| Immigrants | Kuwait | 92.6 /100 | #122 | Exceptional 85.1% |
| Armenians | 92.2 /100 | #123 | Exceptional 85.0% |
| Australians | 92.0 /100 | #124 | Exceptional 85.0% |