Luxembourger vs Blackfeet Average Family Size
COMPARE
Luxembourger
Blackfeet
Average Family Size
Average Family Size Comparison
Luxembourgers
Blackfeet
3.10
AVERAGE FAMILY SIZE
0.0/ 100
METRIC RATING
335th/ 347
METRIC RANK
3.24
AVERAGE FAMILY SIZE
75.0/ 100
METRIC RATING
148th/ 347
METRIC RANK
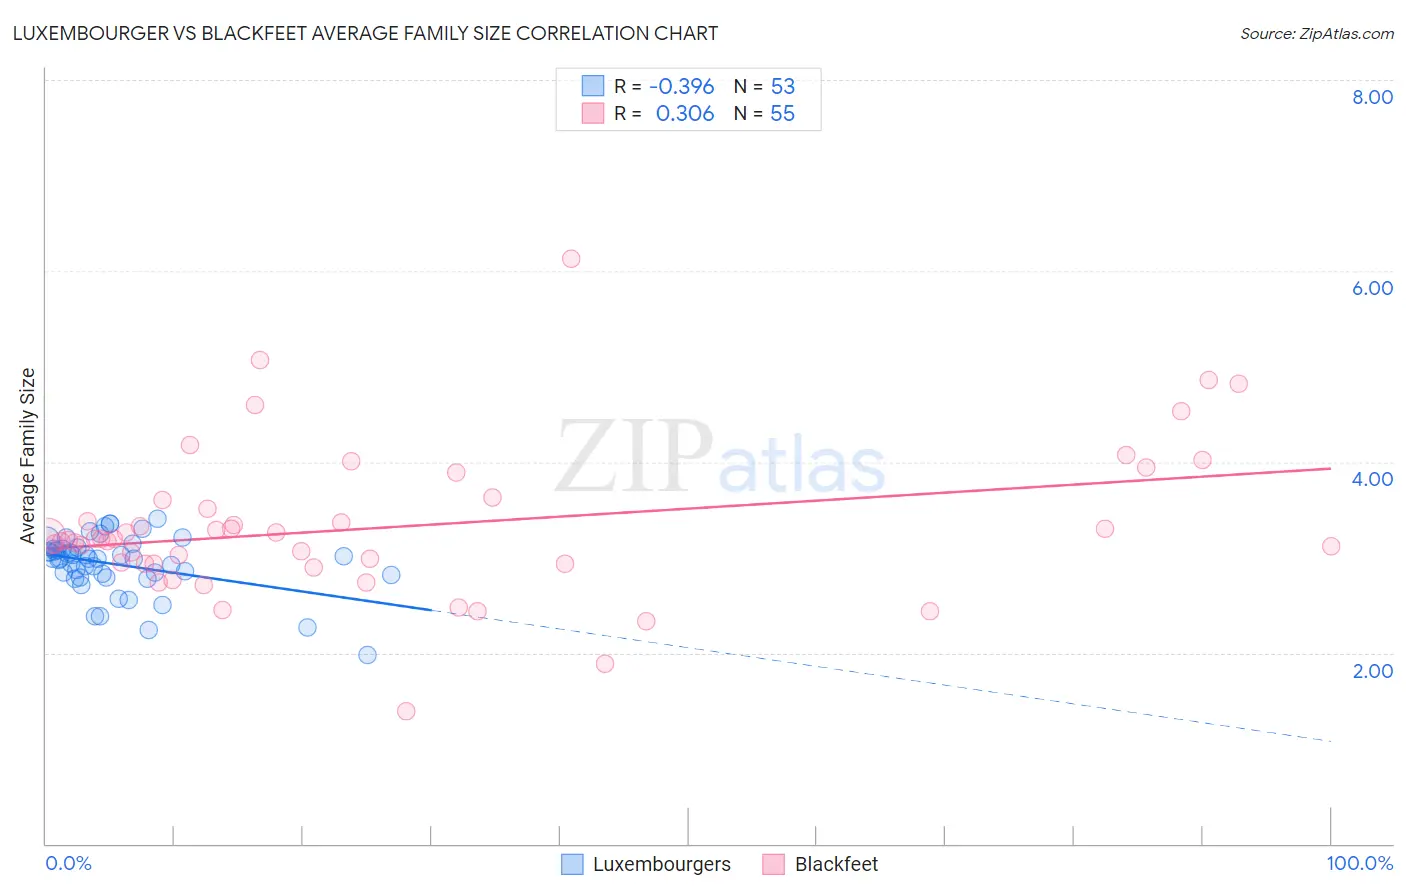
Luxembourger vs Blackfeet Average Family Size Correlation Chart
The statistical analysis conducted on geographies consisting of 144,654,567 people shows a mild negative correlation between the proportion of Luxembourgers and average family size in the United States with a correlation coefficient (R) of -0.396 and weighted average of 3.10. Similarly, the statistical analysis conducted on geographies consisting of 309,476,508 people shows a mild positive correlation between the proportion of Blackfeet and average family size in the United States with a correlation coefficient (R) of 0.306 and weighted average of 3.24, a difference of 4.6%.
Average Family Size Correlation Summary
| Measurement | Luxembourger | Blackfeet |
| Minimum | 1.98 | 1.39 |
| Maximum | 3.40 | 6.13 |
| Range | 1.42 | 4.74 |
| Mean | 2.92 | 3.32 |
| Median | 2.98 | 3.19 |
| Interquartile 25% (IQ1) | 2.81 | 2.93 |
| Interquartile 75% (IQ3) | 3.09 | 3.60 |
| Interquartile Range (IQR) | 0.28 | 0.67 |
| Standard Deviation (Sample) | 0.30 | 0.80 |
| Standard Deviation (Population) | 0.30 | 0.79 |
Similar Demographics by Average Family Size
Demographics Similar to Luxembourgers by Average Family Size
In terms of average family size, the demographic groups most similar to Luxembourgers are Estonian (3.10, a difference of 0.030%), Lithuanian (3.10, a difference of 0.030%), Irish (3.10, a difference of 0.060%), Scotch-Irish (3.11, a difference of 0.080%), and Scottish (3.11, a difference of 0.080%).
| Demographics | Rating | Rank | Average Family Size |
| Czechs | 0.0 /100 | #328 | Tragic 3.11 |
| Belgians | 0.0 /100 | #329 | Tragic 3.11 |
| Latvians | 0.0 /100 | #330 | Tragic 3.11 |
| Scotch-Irish | 0.0 /100 | #331 | Tragic 3.11 |
| Scottish | 0.0 /100 | #332 | Tragic 3.11 |
| Estonians | 0.0 /100 | #333 | Tragic 3.10 |
| Lithuanians | 0.0 /100 | #334 | Tragic 3.10 |
| Luxembourgers | 0.0 /100 | #335 | Tragic 3.10 |
| Irish | 0.0 /100 | #336 | Tragic 3.10 |
| Swedes | 0.0 /100 | #337 | Tragic 3.10 |
| French | 0.0 /100 | #338 | Tragic 3.10 |
| Croatians | 0.0 /100 | #339 | Tragic 3.10 |
| Finns | 0.0 /100 | #340 | Tragic 3.09 |
| Poles | 0.0 /100 | #341 | Tragic 3.09 |
| Germans | 0.0 /100 | #342 | Tragic 3.09 |
Demographics Similar to Blackfeet by Average Family Size
In terms of average family size, the demographic groups most similar to Blackfeet are Immigrants from Jordan (3.24, a difference of 0.020%), Assyrian/Chaldean/Syriac (3.24, a difference of 0.030%), Indian (Asian) (3.24, a difference of 0.030%), Jordanian (3.24, a difference of 0.040%), and Spanish American (3.24, a difference of 0.060%).
| Demographics | Rating | Rank | Average Family Size |
| Venezuelans | 81.4 /100 | #141 | Excellent 3.25 |
| Liberians | 81.2 /100 | #142 | Excellent 3.25 |
| Bhutanese | 81.0 /100 | #143 | Excellent 3.25 |
| Tsimshian | 80.2 /100 | #144 | Excellent 3.25 |
| Armenians | 78.2 /100 | #145 | Good 3.25 |
| Immigrants | Africa | 77.9 /100 | #146 | Good 3.25 |
| Immigrants | Jordan | 75.7 /100 | #147 | Good 3.24 |
| Blackfeet | 75.0 /100 | #148 | Good 3.24 |
| Assyrians/Chaldeans/Syriacs | 73.8 /100 | #149 | Good 3.24 |
| Indians (Asian) | 73.6 /100 | #150 | Good 3.24 |
| Jordanians | 73.5 /100 | #151 | Good 3.24 |
| Spanish Americans | 72.5 /100 | #152 | Good 3.24 |
| Immigrants | Eritrea | 71.4 /100 | #153 | Good 3.24 |
| Immigrants | Egypt | 70.0 /100 | #154 | Good 3.24 |
| Seminole | 68.2 /100 | #155 | Good 3.24 |