Luxembourger vs Bermudan Average Family Size
COMPARE
Luxembourger
Bermudan
Average Family Size
Average Family Size Comparison
Luxembourgers
Bermudans
3.10
AVERAGE FAMILY SIZE
0.0/ 100
METRIC RATING
335th/ 347
METRIC RANK
3.20
AVERAGE FAMILY SIZE
11.0/ 100
METRIC RATING
216th/ 347
METRIC RANK
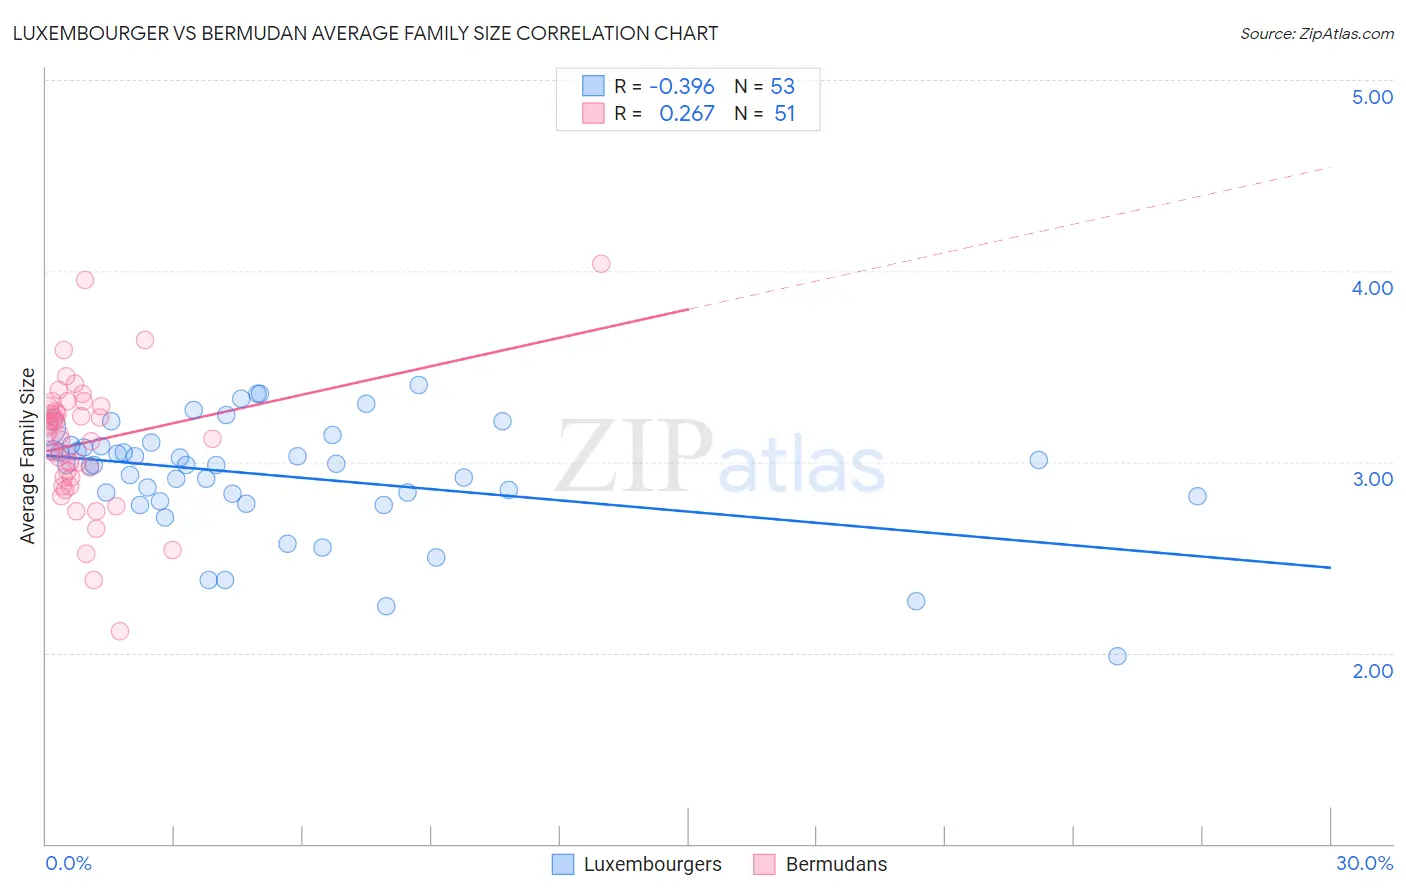
Luxembourger vs Bermudan Average Family Size Correlation Chart
The statistical analysis conducted on geographies consisting of 144,654,567 people shows a mild negative correlation between the proportion of Luxembourgers and average family size in the United States with a correlation coefficient (R) of -0.396 and weighted average of 3.10. Similarly, the statistical analysis conducted on geographies consisting of 55,716,155 people shows a weak positive correlation between the proportion of Bermudans and average family size in the United States with a correlation coefficient (R) of 0.267 and weighted average of 3.20, a difference of 3.1%.
Average Family Size Correlation Summary
| Measurement | Luxembourger | Bermudan |
| Minimum | 1.98 | 2.11 |
| Maximum | 3.40 | 4.04 |
| Range | 1.42 | 1.93 |
| Mean | 2.92 | 3.10 |
| Median | 2.98 | 3.14 |
| Interquartile 25% (IQ1) | 2.81 | 2.92 |
| Interquartile 75% (IQ3) | 3.09 | 3.28 |
| Interquartile Range (IQR) | 0.28 | 0.36 |
| Standard Deviation (Sample) | 0.30 | 0.35 |
| Standard Deviation (Population) | 0.30 | 0.34 |
Similar Demographics by Average Family Size
Demographics Similar to Luxembourgers by Average Family Size
In terms of average family size, the demographic groups most similar to Luxembourgers are Estonian (3.10, a difference of 0.030%), Lithuanian (3.10, a difference of 0.030%), Irish (3.10, a difference of 0.060%), Scotch-Irish (3.11, a difference of 0.080%), and Scottish (3.11, a difference of 0.080%).
| Demographics | Rating | Rank | Average Family Size |
| Czechs | 0.0 /100 | #328 | Tragic 3.11 |
| Belgians | 0.0 /100 | #329 | Tragic 3.11 |
| Latvians | 0.0 /100 | #330 | Tragic 3.11 |
| Scotch-Irish | 0.0 /100 | #331 | Tragic 3.11 |
| Scottish | 0.0 /100 | #332 | Tragic 3.11 |
| Estonians | 0.0 /100 | #333 | Tragic 3.10 |
| Lithuanians | 0.0 /100 | #334 | Tragic 3.10 |
| Luxembourgers | 0.0 /100 | #335 | Tragic 3.10 |
| Irish | 0.0 /100 | #336 | Tragic 3.10 |
| Swedes | 0.0 /100 | #337 | Tragic 3.10 |
| French | 0.0 /100 | #338 | Tragic 3.10 |
| Croatians | 0.0 /100 | #339 | Tragic 3.10 |
| Finns | 0.0 /100 | #340 | Tragic 3.09 |
| Poles | 0.0 /100 | #341 | Tragic 3.09 |
| Germans | 0.0 /100 | #342 | Tragic 3.09 |
Demographics Similar to Bermudans by Average Family Size
In terms of average family size, the demographic groups most similar to Bermudans are Delaware (3.20, a difference of 0.0%), Somali (3.20, a difference of 0.010%), Mongolian (3.20, a difference of 0.030%), Immigrants from Somalia (3.20, a difference of 0.030%), and Immigrants from Iran (3.20, a difference of 0.050%).
| Demographics | Rating | Rank | Average Family Size |
| Sudanese | 13.3 /100 | #209 | Poor 3.20 |
| Zimbabweans | 12.6 /100 | #210 | Poor 3.20 |
| Immigrants | Iran | 12.1 /100 | #211 | Poor 3.20 |
| Creek | 12.1 /100 | #212 | Poor 3.20 |
| Mongolians | 11.5 /100 | #213 | Poor 3.20 |
| Somalis | 11.2 /100 | #214 | Poor 3.20 |
| Delaware | 11.1 /100 | #215 | Poor 3.20 |
| Bermudans | 11.0 /100 | #216 | Poor 3.20 |
| Immigrants | Somalia | 10.3 /100 | #217 | Poor 3.20 |
| French American Indians | 9.8 /100 | #218 | Tragic 3.20 |
| Pennsylvania Germans | 9.3 /100 | #219 | Tragic 3.19 |
| Lebanese | 9.1 /100 | #220 | Tragic 3.19 |
| Immigrants | Ukraine | 7.2 /100 | #221 | Tragic 3.19 |
| Immigrants | Kuwait | 7.2 /100 | #222 | Tragic 3.19 |
| Immigrants | Zimbabwe | 7.1 /100 | #223 | Tragic 3.19 |