Chilean vs Immigrants from Denmark Average Family Size
COMPARE
Chilean
Immigrants from Denmark
Average Family Size
Average Family Size Comparison
Chileans
Immigrants from Denmark
3.23
AVERAGE FAMILY SIZE
53.2/ 100
METRIC RATING
171st/ 347
METRIC RANK
3.15
AVERAGE FAMILY SIZE
0.4/ 100
METRIC RATING
281st/ 347
METRIC RANK
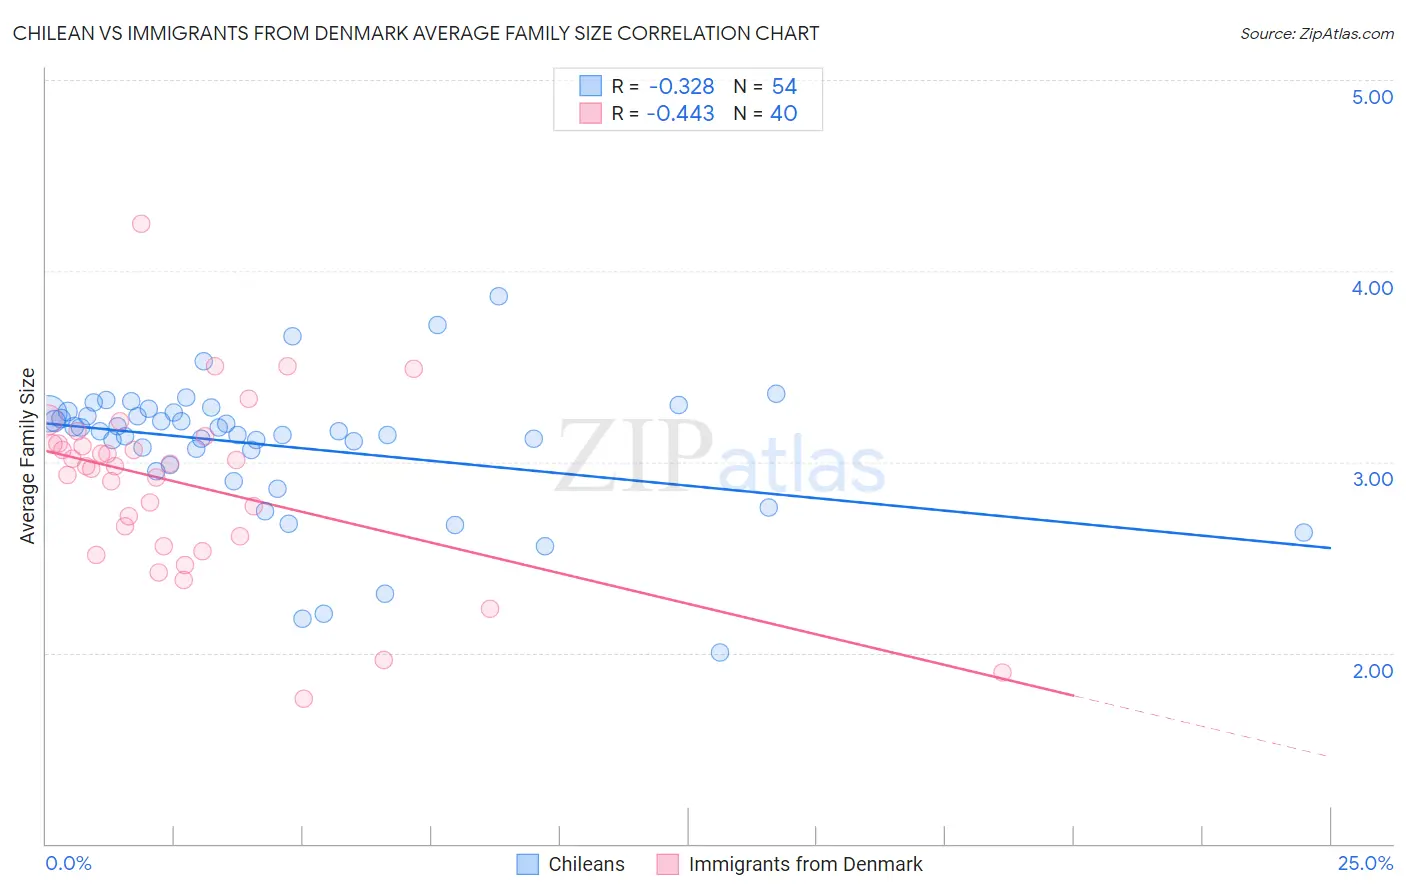
Chilean vs Immigrants from Denmark Average Family Size Correlation Chart
The statistical analysis conducted on geographies consisting of 256,563,974 people shows a mild negative correlation between the proportion of Chileans and average family size in the United States with a correlation coefficient (R) of -0.328 and weighted average of 3.23. Similarly, the statistical analysis conducted on geographies consisting of 136,403,907 people shows a moderate negative correlation between the proportion of Immigrants from Denmark and average family size in the United States with a correlation coefficient (R) of -0.443 and weighted average of 3.15, a difference of 2.6%.
Average Family Size Correlation Summary
| Measurement | Chilean | Immigrants from Denmark |
| Minimum | 2.00 | 1.76 |
| Maximum | 3.87 | 4.25 |
| Range | 1.87 | 2.49 |
| Mean | 3.08 | 2.88 |
| Median | 3.16 | 2.98 |
| Interquartile 25% (IQ1) | 2.98 | 2.58 |
| Interquartile 75% (IQ3) | 3.26 | 3.10 |
| Interquartile Range (IQR) | 0.27 | 0.51 |
| Standard Deviation (Sample) | 0.36 | 0.47 |
| Standard Deviation (Population) | 0.35 | 0.46 |
Similar Demographics by Average Family Size
Demographics Similar to Chileans by Average Family Size
In terms of average family size, the demographic groups most similar to Chileans are Arab (3.23, a difference of 0.010%), Immigrants from Congo (3.23, a difference of 0.010%), Taiwanese (3.23, a difference of 0.020%), Aleut (3.23, a difference of 0.020%), and Immigrants from Uruguay (3.23, a difference of 0.020%).
| Demographics | Rating | Rank | Average Family Size |
| Egyptians | 58.6 /100 | #164 | Average 3.23 |
| Ugandans | 58.4 /100 | #165 | Average 3.23 |
| Immigrants | Senegal | 57.5 /100 | #166 | Average 3.23 |
| Dutch West Indians | 56.9 /100 | #167 | Average 3.23 |
| Taiwanese | 54.2 /100 | #168 | Average 3.23 |
| Aleuts | 54.1 /100 | #169 | Average 3.23 |
| Arabs | 53.8 /100 | #170 | Average 3.23 |
| Chileans | 53.2 /100 | #171 | Average 3.23 |
| Immigrants | Congo | 52.7 /100 | #172 | Average 3.23 |
| Immigrants | Uruguay | 52.0 /100 | #173 | Average 3.23 |
| Immigrants | South Central Asia | 50.0 /100 | #174 | Average 3.23 |
| Immigrants | China | 49.9 /100 | #175 | Average 3.23 |
| Israelis | 48.7 /100 | #176 | Average 3.23 |
| Argentineans | 47.4 /100 | #177 | Average 3.23 |
| Spaniards | 47.2 /100 | #178 | Average 3.23 |
Demographics Similar to Immigrants from Denmark by Average Family Size
In terms of average family size, the demographic groups most similar to Immigrants from Denmark are Yugoslavian (3.15, a difference of 0.010%), German Russian (3.15, a difference of 0.020%), Immigrants from England (3.15, a difference of 0.040%), Immigrants from France (3.15, a difference of 0.040%), and Immigrants from Europe (3.15, a difference of 0.060%).
| Demographics | Rating | Rank | Average Family Size |
| Immigrants | Belgium | 0.6 /100 | #274 | Tragic 3.15 |
| Cambodians | 0.6 /100 | #275 | Tragic 3.15 |
| Immigrants | Bosnia and Herzegovina | 0.5 /100 | #276 | Tragic 3.15 |
| Swiss | 0.5 /100 | #277 | Tragic 3.15 |
| Okinawans | 0.5 /100 | #278 | Tragic 3.15 |
| Immigrants | Europe | 0.5 /100 | #279 | Tragic 3.15 |
| Immigrants | England | 0.4 /100 | #280 | Tragic 3.15 |
| Immigrants | Denmark | 0.4 /100 | #281 | Tragic 3.15 |
| Yugoslavians | 0.4 /100 | #282 | Tragic 3.15 |
| German Russians | 0.4 /100 | #283 | Tragic 3.15 |
| Immigrants | France | 0.4 /100 | #284 | Tragic 3.15 |
| Whites/Caucasians | 0.3 /100 | #285 | Tragic 3.14 |
| Immigrants | Netherlands | 0.3 /100 | #286 | Tragic 3.14 |
| Greeks | 0.3 /100 | #287 | Tragic 3.14 |
| Immigrants | Czechoslovakia | 0.3 /100 | #288 | Tragic 3.14 |