Luxembourger vs Immigrants from Denmark Unemployment
COMPARE
Luxembourger
Immigrants from Denmark
Unemployment
Unemployment Comparison
Luxembourgers
Immigrants from Denmark
4.3%
UNEMPLOYMENT
100.0/ 100
METRIC RATING
2nd/ 347
METRIC RANK
5.1%
UNEMPLOYMENT
84.3/ 100
METRIC RATING
140th/ 347
METRIC RANK
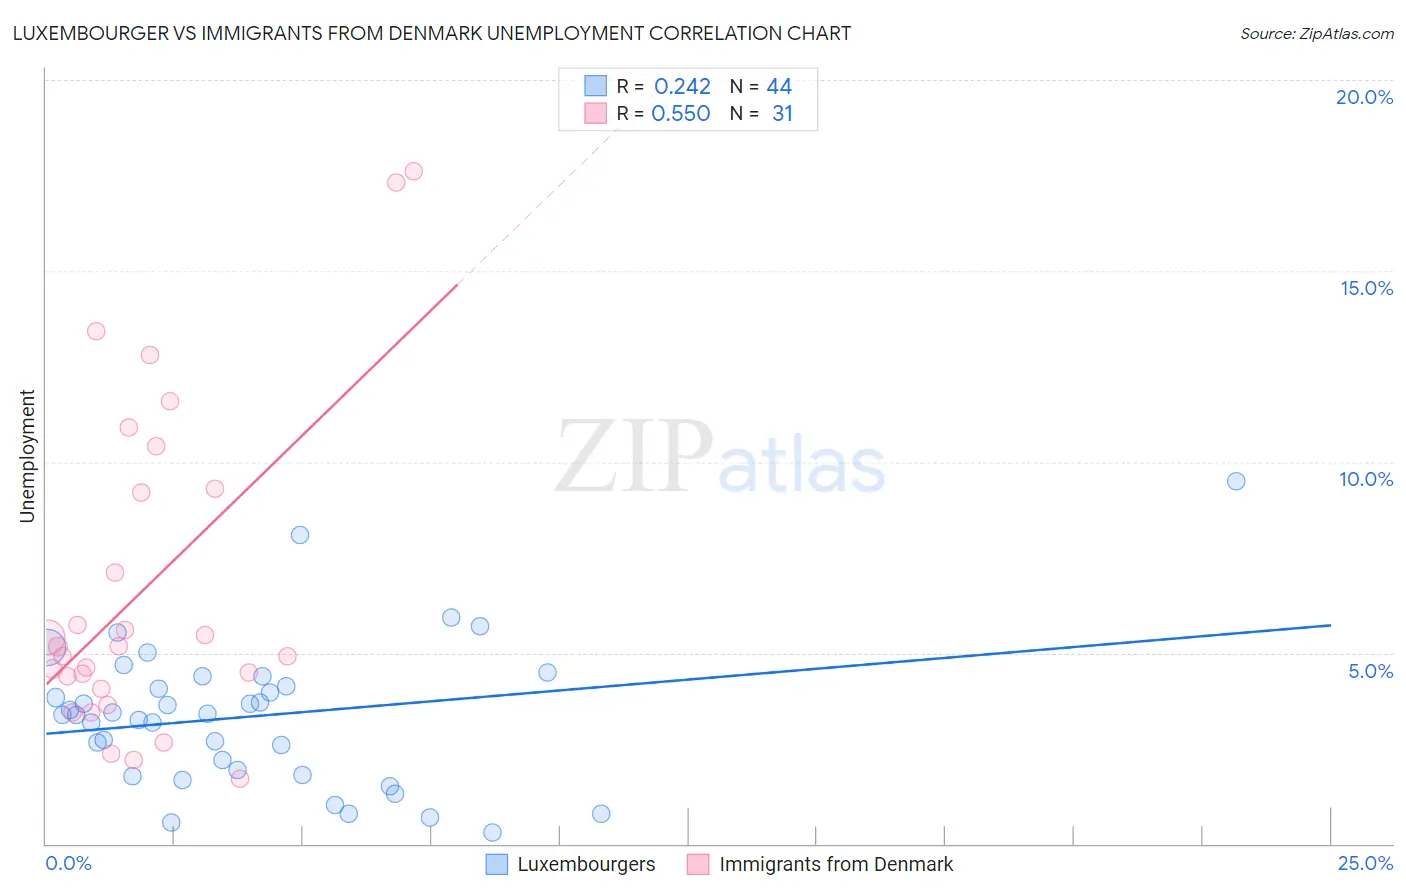
Luxembourger vs Immigrants from Denmark Unemployment Correlation Chart
The statistical analysis conducted on geographies consisting of 144,557,593 people shows a weak positive correlation between the proportion of Luxembourgers and unemployment in the United States with a correlation coefficient (R) of 0.242 and weighted average of 4.3%. Similarly, the statistical analysis conducted on geographies consisting of 136,363,716 people shows a substantial positive correlation between the proportion of Immigrants from Denmark and unemployment in the United States with a correlation coefficient (R) of 0.550 and weighted average of 5.1%, a difference of 18.1%.
Unemployment Correlation Summary
| Measurement | Luxembourger | Immigrants from Denmark |
| Minimum | 0.30% | 1.7% |
| Maximum | 9.5% | 17.6% |
| Range | 9.2% | 15.9% |
| Mean | 3.3% | 6.7% |
| Median | 3.4% | 5.2% |
| Interquartile 25% (IQ1) | 1.9% | 4.0% |
| Interquartile 75% (IQ3) | 4.3% | 9.3% |
| Interquartile Range (IQR) | 2.4% | 5.3% |
| Standard Deviation (Sample) | 1.9% | 4.2% |
| Standard Deviation (Population) | 1.9% | 4.2% |
Similar Demographics by Unemployment
Demographics Similar to Luxembourgers by Unemployment
In terms of unemployment, the demographic groups most similar to Luxembourgers are Czech (4.3%, a difference of 0.10%), Danish (4.3%, a difference of 0.25%), Swedish (4.4%, a difference of 2.5%), German (4.5%, a difference of 3.4%), and Norwegian (4.2%, a difference of 3.4%).
| Demographics | Rating | Rank | Unemployment |
| Norwegians | 100.0 /100 | #1 | Exceptional 4.2% |
| Luxembourgers | 100.0 /100 | #2 | Exceptional 4.3% |
| Czechs | 100.0 /100 | #3 | Exceptional 4.3% |
| Danes | 100.0 /100 | #4 | Exceptional 4.3% |
| Swedes | 100.0 /100 | #5 | Exceptional 4.4% |
| Germans | 100.0 /100 | #6 | Exceptional 4.5% |
| Immigrants | India | 100.0 /100 | #7 | Exceptional 4.5% |
| Swiss | 100.0 /100 | #8 | Exceptional 4.5% |
| Scandinavians | 100.0 /100 | #9 | Exceptional 4.5% |
| Dutch | 100.0 /100 | #10 | Exceptional 4.6% |
| English | 100.0 /100 | #11 | Exceptional 4.6% |
| Pennsylvania Germans | 100.0 /100 | #12 | Exceptional 4.6% |
| Belgians | 100.0 /100 | #13 | Exceptional 4.6% |
| Immigrants | Cuba | 100.0 /100 | #14 | Exceptional 4.6% |
| Europeans | 99.9 /100 | #15 | Exceptional 4.6% |
Demographics Similar to Immigrants from Denmark by Unemployment
In terms of unemployment, the demographic groups most similar to Immigrants from Denmark are Palestinian (5.1%, a difference of 0.11%), Immigrants from Pakistan (5.1%, a difference of 0.12%), Pakistani (5.1%, a difference of 0.13%), Immigrants from Hungary (5.1%, a difference of 0.16%), and Immigrants from Saudi Arabia (5.1%, a difference of 0.17%).
| Demographics | Rating | Rank | Unemployment |
| Immigrants | Jordan | 86.6 /100 | #133 | Excellent 5.1% |
| Immigrants | Europe | 86.3 /100 | #134 | Excellent 5.1% |
| Immigrants | Burma/Myanmar | 86.2 /100 | #135 | Excellent 5.1% |
| Immigrants | Spain | 86.2 /100 | #136 | Excellent 5.1% |
| Immigrants | Saudi Arabia | 85.6 /100 | #137 | Excellent 5.1% |
| Immigrants | Hungary | 85.6 /100 | #138 | Excellent 5.1% |
| Pakistanis | 85.3 /100 | #139 | Excellent 5.1% |
| Immigrants | Denmark | 84.3 /100 | #140 | Excellent 5.1% |
| Palestinians | 83.4 /100 | #141 | Excellent 5.1% |
| Immigrants | Pakistan | 83.2 /100 | #142 | Excellent 5.1% |
| Immigrants | Chile | 82.8 /100 | #143 | Excellent 5.1% |
| Indonesians | 82.3 /100 | #144 | Excellent 5.1% |
| Immigrants | Norway | 81.8 /100 | #145 | Excellent 5.1% |
| Immigrants | Asia | 81.8 /100 | #146 | Excellent 5.1% |
| Indians (Asian) | 81.6 /100 | #147 | Excellent 5.1% |