Luxembourger vs Immigrants from Denmark Ambulatory Disability
COMPARE
Luxembourger
Immigrants from Denmark
Ambulatory Disability
Ambulatory Disability Comparison
Luxembourgers
Immigrants from Denmark
5.6%
AMBULATORY DISABILITY
99.9/ 100
METRIC RATING
50th/ 347
METRIC RANK
5.8%
AMBULATORY DISABILITY
98.6/ 100
METRIC RATING
93rd/ 347
METRIC RANK
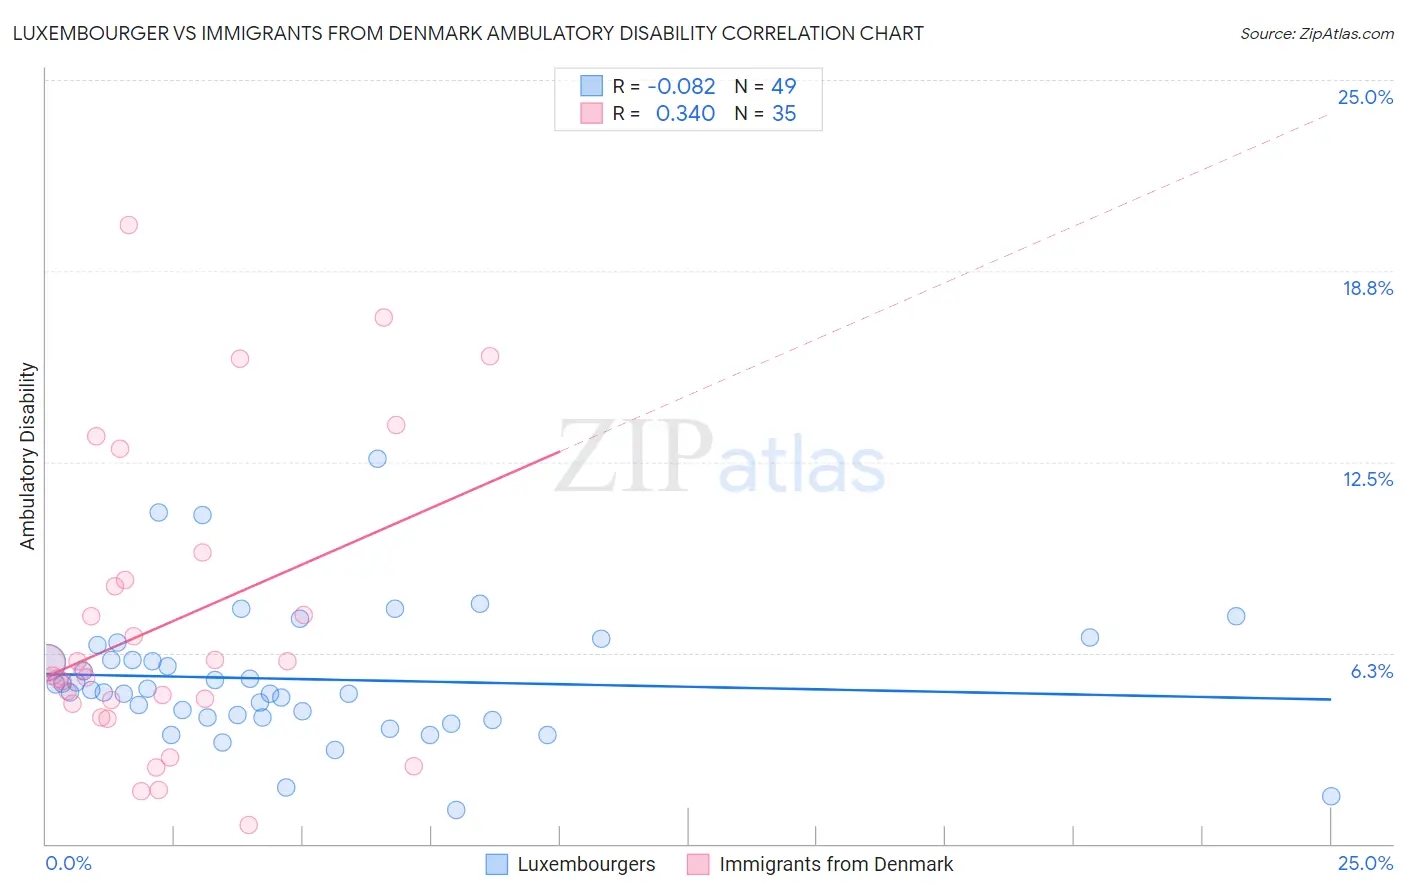
Luxembourger vs Immigrants from Denmark Ambulatory Disability Correlation Chart
The statistical analysis conducted on geographies consisting of 144,679,340 people shows a slight negative correlation between the proportion of Luxembourgers and percentage of population with ambulatory disability in the United States with a correlation coefficient (R) of -0.082 and weighted average of 5.6%. Similarly, the statistical analysis conducted on geographies consisting of 136,424,948 people shows a mild positive correlation between the proportion of Immigrants from Denmark and percentage of population with ambulatory disability in the United States with a correlation coefficient (R) of 0.340 and weighted average of 5.8%, a difference of 3.3%.
Ambulatory Disability Correlation Summary
| Measurement | Luxembourger | Immigrants from Denmark |
| Minimum | 1.1% | 0.61% |
| Maximum | 12.6% | 20.3% |
| Range | 11.5% | 19.6% |
| Mean | 5.4% | 7.2% |
| Median | 5.0% | 5.7% |
| Interquartile 25% (IQ1) | 4.1% | 4.6% |
| Interquartile 75% (IQ3) | 6.3% | 8.7% |
| Interquartile Range (IQR) | 2.1% | 4.1% |
| Standard Deviation (Sample) | 2.2% | 4.8% |
| Standard Deviation (Population) | 2.1% | 4.7% |
Similar Demographics by Ambulatory Disability
Demographics Similar to Luxembourgers by Ambulatory Disability
In terms of ambulatory disability, the demographic groups most similar to Luxembourgers are Taiwanese (5.6%, a difference of 0.10%), Jordanian (5.6%, a difference of 0.19%), Immigrants from Egypt (5.6%, a difference of 0.20%), Immigrants from Eastern Africa (5.6%, a difference of 0.25%), and Immigrants from Bulgaria (5.6%, a difference of 0.31%).
| Demographics | Rating | Rank | Ambulatory Disability |
| Paraguayans | 99.9 /100 | #43 | Exceptional 5.5% |
| Immigrants | Indonesia | 99.9 /100 | #44 | Exceptional 5.5% |
| Immigrants | Sweden | 99.9 /100 | #45 | Exceptional 5.6% |
| Egyptians | 99.9 /100 | #46 | Exceptional 5.6% |
| Immigrants | Japan | 99.9 /100 | #47 | Exceptional 5.6% |
| Immigrants | Argentina | 99.9 /100 | #48 | Exceptional 5.6% |
| Bulgarians | 99.9 /100 | #49 | Exceptional 5.6% |
| Luxembourgers | 99.9 /100 | #50 | Exceptional 5.6% |
| Taiwanese | 99.8 /100 | #51 | Exceptional 5.6% |
| Jordanians | 99.8 /100 | #52 | Exceptional 5.6% |
| Immigrants | Egypt | 99.8 /100 | #53 | Exceptional 5.6% |
| Immigrants | Eastern Africa | 99.8 /100 | #54 | Exceptional 5.6% |
| Immigrants | Bulgaria | 99.8 /100 | #55 | Exceptional 5.6% |
| Inupiat | 99.8 /100 | #56 | Exceptional 5.6% |
| Immigrants | Brazil | 99.8 /100 | #57 | Exceptional 5.6% |
Demographics Similar to Immigrants from Denmark by Ambulatory Disability
In terms of ambulatory disability, the demographic groups most similar to Immigrants from Denmark are Immigrants from Sierra Leone (5.8%, a difference of 0.010%), Immigrants from Sudan (5.8%, a difference of 0.17%), Bhutanese (5.8%, a difference of 0.18%), Australian (5.8%, a difference of 0.18%), and Kenyan (5.8%, a difference of 0.19%).
| Demographics | Rating | Rank | Ambulatory Disability |
| Latvians | 99.0 /100 | #86 | Exceptional 5.7% |
| Immigrants | Chile | 98.9 /100 | #87 | Exceptional 5.8% |
| Soviet Union | 98.9 /100 | #88 | Exceptional 5.8% |
| Bhutanese | 98.8 /100 | #89 | Exceptional 5.8% |
| Australians | 98.8 /100 | #90 | Exceptional 5.8% |
| Immigrants | Sudan | 98.8 /100 | #91 | Exceptional 5.8% |
| Immigrants | Sierra Leone | 98.6 /100 | #92 | Exceptional 5.8% |
| Immigrants | Denmark | 98.6 /100 | #93 | Exceptional 5.8% |
| Kenyans | 98.4 /100 | #94 | Exceptional 5.8% |
| Immigrants | El Salvador | 98.4 /100 | #95 | Exceptional 5.8% |
| Salvadorans | 98.4 /100 | #96 | Exceptional 5.8% |
| Immigrants | Somalia | 98.3 /100 | #97 | Exceptional 5.8% |
| Immigrants | Lebanon | 98.3 /100 | #98 | Exceptional 5.8% |
| Immigrants | Northern Europe | 98.2 /100 | #99 | Exceptional 5.8% |
| Immigrants | Serbia | 97.9 /100 | #100 | Exceptional 5.8% |