Serbian vs Immigrants from Denmark Average Family Size
COMPARE
Serbian
Immigrants from Denmark
Average Family Size
Average Family Size Comparison
Serbians
Immigrants from Denmark
3.12
AVERAGE FAMILY SIZE
0.1/ 100
METRIC RATING
316th/ 347
METRIC RANK
3.15
AVERAGE FAMILY SIZE
0.4/ 100
METRIC RATING
281st/ 347
METRIC RANK
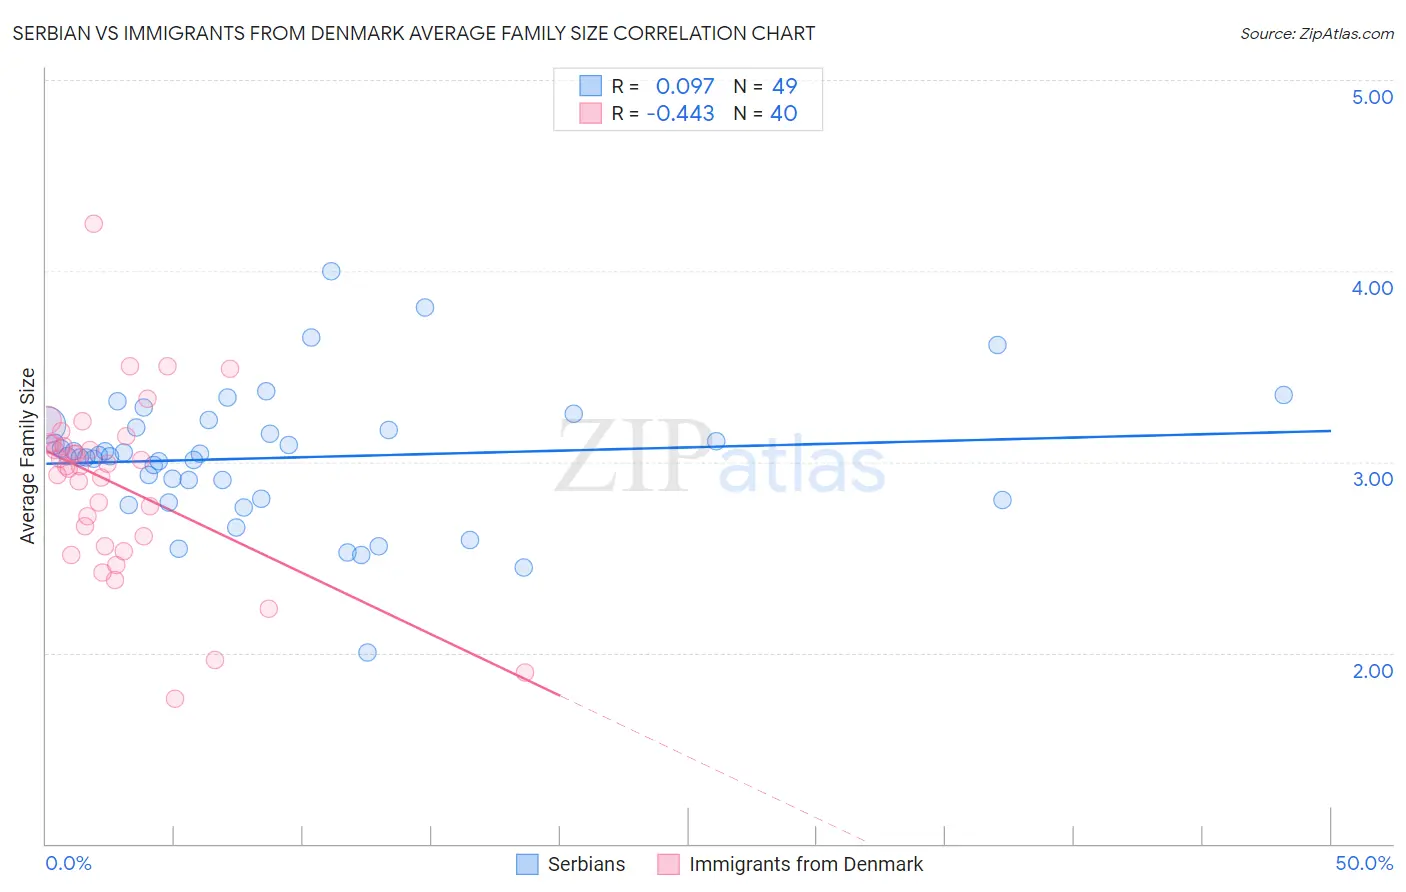
Serbian vs Immigrants from Denmark Average Family Size Correlation Chart
The statistical analysis conducted on geographies consisting of 267,532,826 people shows a slight positive correlation between the proportion of Serbians and average family size in the United States with a correlation coefficient (R) of 0.097 and weighted average of 3.12. Similarly, the statistical analysis conducted on geographies consisting of 136,403,907 people shows a moderate negative correlation between the proportion of Immigrants from Denmark and average family size in the United States with a correlation coefficient (R) of -0.443 and weighted average of 3.15, a difference of 0.84%.
Average Family Size Correlation Summary
| Measurement | Serbian | Immigrants from Denmark |
| Minimum | 2.00 | 1.76 |
| Maximum | 4.00 | 4.25 |
| Range | 2.00 | 2.49 |
| Mean | 3.02 | 2.88 |
| Median | 3.03 | 2.98 |
| Interquartile 25% (IQ1) | 2.81 | 2.58 |
| Interquartile 75% (IQ3) | 3.19 | 3.10 |
| Interquartile Range (IQR) | 0.38 | 0.51 |
| Standard Deviation (Sample) | 0.35 | 0.47 |
| Standard Deviation (Population) | 0.35 | 0.46 |
Similar Demographics by Average Family Size
Demographics Similar to Serbians by Average Family Size
In terms of average family size, the demographic groups most similar to Serbians are Italian (3.12, a difference of 0.060%), Eastern European (3.12, a difference of 0.070%), Welsh (3.12, a difference of 0.070%), Immigrants from Scotland (3.12, a difference of 0.090%), and Russian (3.12, a difference of 0.11%).
| Demographics | Rating | Rank | Average Family Size |
| Northern Europeans | 0.1 /100 | #309 | Tragic 3.13 |
| Czechoslovakians | 0.1 /100 | #310 | Tragic 3.13 |
| Immigrants | Northern Europe | 0.1 /100 | #311 | Tragic 3.13 |
| Immigrants | Australia | 0.1 /100 | #312 | Tragic 3.13 |
| Bulgarians | 0.1 /100 | #313 | Tragic 3.13 |
| Russians | 0.1 /100 | #314 | Tragic 3.12 |
| Immigrants | Scotland | 0.1 /100 | #315 | Tragic 3.12 |
| Serbians | 0.1 /100 | #316 | Tragic 3.12 |
| Italians | 0.1 /100 | #317 | Tragic 3.12 |
| Eastern Europeans | 0.1 /100 | #318 | Tragic 3.12 |
| Welsh | 0.1 /100 | #319 | Tragic 3.12 |
| Immigrants | North America | 0.0 /100 | #320 | Tragic 3.12 |
| Immigrants | Austria | 0.0 /100 | #321 | Tragic 3.12 |
| Immigrants | Canada | 0.0 /100 | #322 | Tragic 3.12 |
| Soviet Union | 0.0 /100 | #323 | Tragic 3.11 |
Demographics Similar to Immigrants from Denmark by Average Family Size
In terms of average family size, the demographic groups most similar to Immigrants from Denmark are Yugoslavian (3.15, a difference of 0.010%), German Russian (3.15, a difference of 0.020%), Immigrants from England (3.15, a difference of 0.040%), Immigrants from France (3.15, a difference of 0.040%), and Immigrants from Europe (3.15, a difference of 0.060%).
| Demographics | Rating | Rank | Average Family Size |
| Immigrants | Belgium | 0.6 /100 | #274 | Tragic 3.15 |
| Cambodians | 0.6 /100 | #275 | Tragic 3.15 |
| Immigrants | Bosnia and Herzegovina | 0.5 /100 | #276 | Tragic 3.15 |
| Swiss | 0.5 /100 | #277 | Tragic 3.15 |
| Okinawans | 0.5 /100 | #278 | Tragic 3.15 |
| Immigrants | Europe | 0.5 /100 | #279 | Tragic 3.15 |
| Immigrants | England | 0.4 /100 | #280 | Tragic 3.15 |
| Immigrants | Denmark | 0.4 /100 | #281 | Tragic 3.15 |
| Yugoslavians | 0.4 /100 | #282 | Tragic 3.15 |
| German Russians | 0.4 /100 | #283 | Tragic 3.15 |
| Immigrants | France | 0.4 /100 | #284 | Tragic 3.15 |
| Whites/Caucasians | 0.3 /100 | #285 | Tragic 3.14 |
| Immigrants | Netherlands | 0.3 /100 | #286 | Tragic 3.14 |
| Greeks | 0.3 /100 | #287 | Tragic 3.14 |
| Immigrants | Czechoslovakia | 0.3 /100 | #288 | Tragic 3.14 |