Immigrants from Russia vs Immigrants from Denmark Average Family Size
COMPARE
Immigrants from Russia
Immigrants from Denmark
Average Family Size
Average Family Size Comparison
Immigrants from Russia
Immigrants from Denmark
3.16
AVERAGE FAMILY SIZE
1.3/ 100
METRIC RATING
262nd/ 347
METRIC RANK
3.15
AVERAGE FAMILY SIZE
0.4/ 100
METRIC RATING
281st/ 347
METRIC RANK
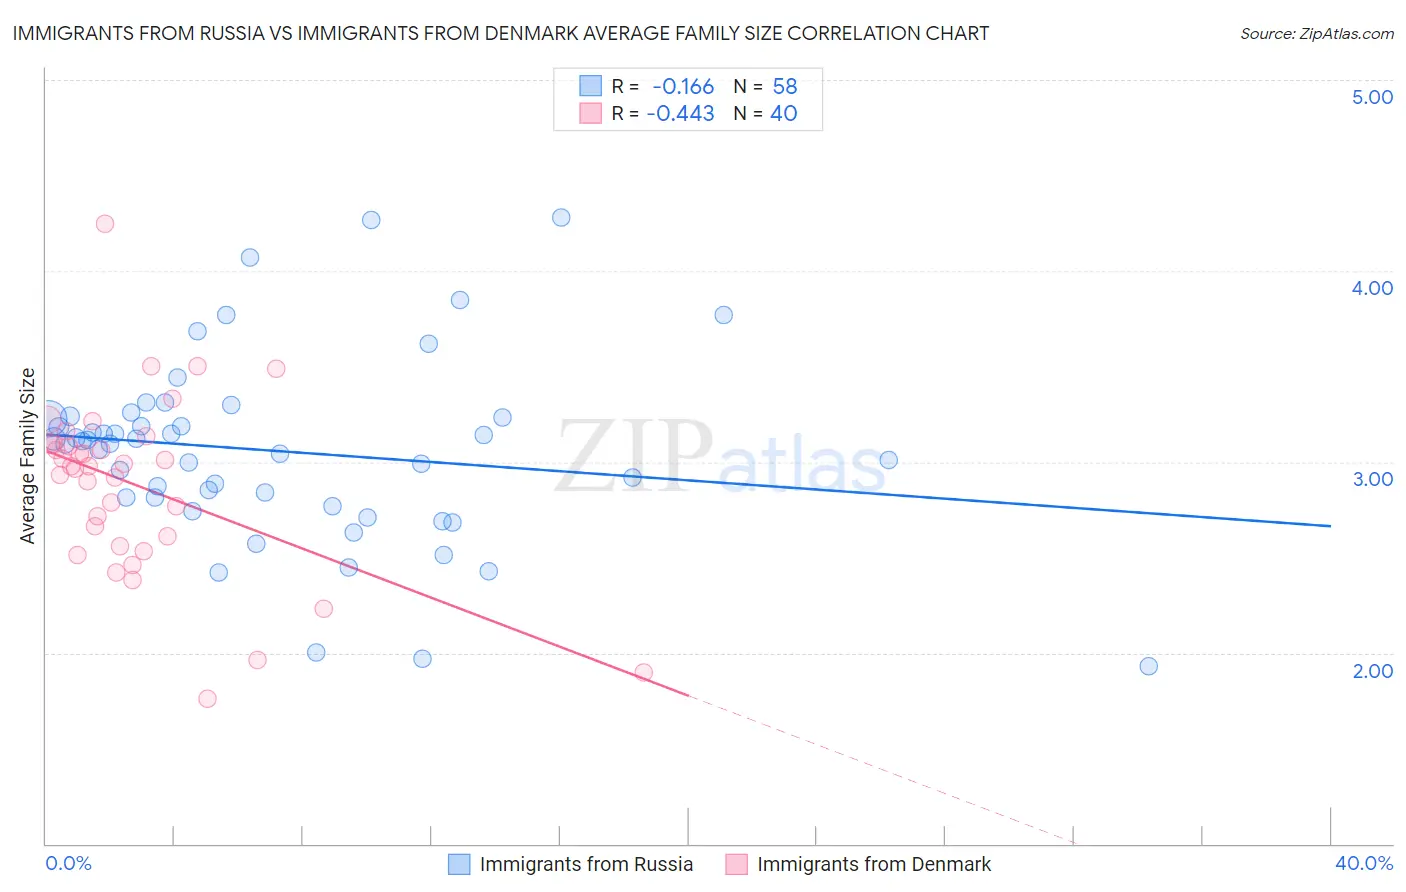
Immigrants from Russia vs Immigrants from Denmark Average Family Size Correlation Chart
The statistical analysis conducted on geographies consisting of 347,722,348 people shows a poor negative correlation between the proportion of Immigrants from Russia and average family size in the United States with a correlation coefficient (R) of -0.166 and weighted average of 3.16. Similarly, the statistical analysis conducted on geographies consisting of 136,403,907 people shows a moderate negative correlation between the proportion of Immigrants from Denmark and average family size in the United States with a correlation coefficient (R) of -0.443 and weighted average of 3.15, a difference of 0.55%.
Average Family Size Correlation Summary
| Measurement | Immigrants from Russia | Immigrants from Denmark |
| Minimum | 1.93 | 1.76 |
| Maximum | 4.28 | 4.25 |
| Range | 2.35 | 2.49 |
| Mean | 3.06 | 2.88 |
| Median | 3.10 | 2.98 |
| Interquartile 25% (IQ1) | 2.81 | 2.58 |
| Interquartile 75% (IQ3) | 3.23 | 3.10 |
| Interquartile Range (IQR) | 0.42 | 0.51 |
| Standard Deviation (Sample) | 0.48 | 0.47 |
| Standard Deviation (Population) | 0.48 | 0.46 |
Demographics Similar to Immigrants from Russia and Immigrants from Denmark by Average Family Size
In terms of average family size, the demographic groups most similar to Immigrants from Russia are Immigrants from North Macedonia (3.16, a difference of 0.010%), Immigrants from Bulgaria (3.16, a difference of 0.10%), American (3.16, a difference of 0.11%), Immigrants from South Africa (3.16, a difference of 0.16%), and Immigrants from Greece (3.16, a difference of 0.18%). Similarly, the demographic groups most similar to Immigrants from Denmark are Immigrants from England (3.15, a difference of 0.040%), Immigrants from Europe (3.15, a difference of 0.060%), Okinawan (3.15, a difference of 0.080%), Swiss (3.15, a difference of 0.11%), and Immigrants from Bosnia and Herzegovina (3.15, a difference of 0.12%).
| Demographics | Rating | Rank | Average Family Size |
| Immigrants | North Macedonia | 1.3 /100 | #261 | Tragic 3.16 |
| Immigrants | Russia | 1.3 /100 | #262 | Tragic 3.16 |
| Immigrants | Bulgaria | 1.0 /100 | #263 | Tragic 3.16 |
| Americans | 1.0 /100 | #264 | Tragic 3.16 |
| Immigrants | South Africa | 0.9 /100 | #265 | Tragic 3.16 |
| Immigrants | Greece | 0.9 /100 | #266 | Tragic 3.16 |
| Iroquois | 0.8 /100 | #267 | Tragic 3.16 |
| Maltese | 0.8 /100 | #268 | Tragic 3.16 |
| Immigrants | Singapore | 0.7 /100 | #269 | Tragic 3.16 |
| Tlingit-Haida | 0.7 /100 | #270 | Tragic 3.16 |
| Immigrants | Germany | 0.7 /100 | #271 | Tragic 3.15 |
| Immigrants | Lithuania | 0.6 /100 | #272 | Tragic 3.15 |
| New Zealanders | 0.6 /100 | #273 | Tragic 3.15 |
| Immigrants | Belgium | 0.6 /100 | #274 | Tragic 3.15 |
| Cambodians | 0.6 /100 | #275 | Tragic 3.15 |
| Immigrants | Bosnia and Herzegovina | 0.5 /100 | #276 | Tragic 3.15 |
| Swiss | 0.5 /100 | #277 | Tragic 3.15 |
| Okinawans | 0.5 /100 | #278 | Tragic 3.15 |
| Immigrants | Europe | 0.5 /100 | #279 | Tragic 3.15 |
| Immigrants | England | 0.4 /100 | #280 | Tragic 3.15 |
| Immigrants | Denmark | 0.4 /100 | #281 | Tragic 3.15 |