Luxembourger vs Alaskan Athabascan Average Family Size
COMPARE
Luxembourger
Alaskan Athabascan
Average Family Size
Average Family Size Comparison
Luxembourgers
Alaskan Athabascans
3.10
AVERAGE FAMILY SIZE
0.0/ 100
METRIC RATING
335th/ 347
METRIC RANK
3.27
AVERAGE FAMILY SIZE
92.4/ 100
METRIC RATING
123rd/ 347
METRIC RANK
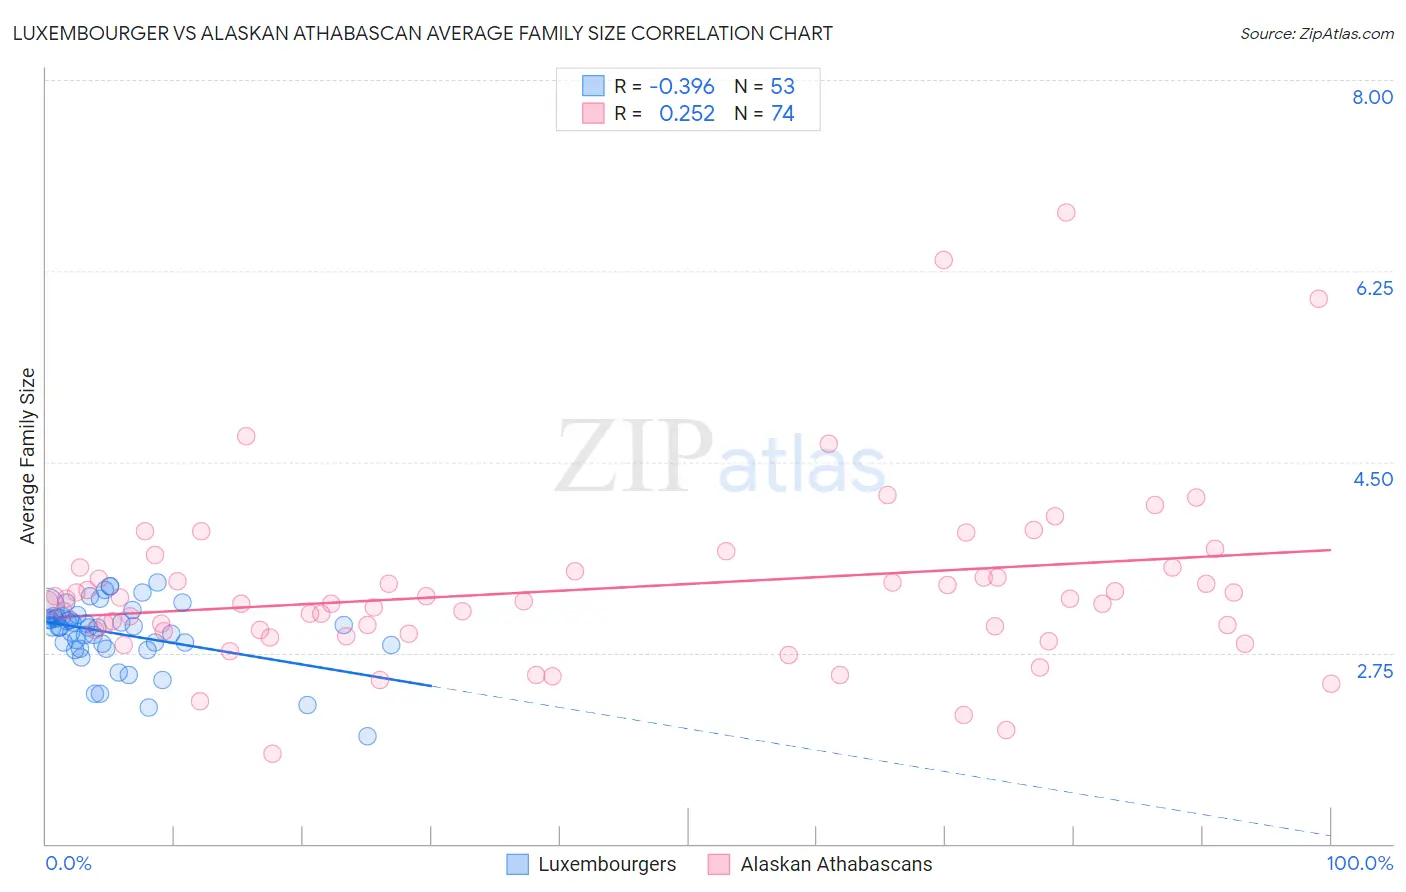
Luxembourger vs Alaskan Athabascan Average Family Size Correlation Chart
The statistical analysis conducted on geographies consisting of 144,654,567 people shows a mild negative correlation between the proportion of Luxembourgers and average family size in the United States with a correlation coefficient (R) of -0.396 and weighted average of 3.10. Similarly, the statistical analysis conducted on geographies consisting of 45,814,644 people shows a weak positive correlation between the proportion of Alaskan Athabascans and average family size in the United States with a correlation coefficient (R) of 0.252 and weighted average of 3.27, a difference of 5.2%.
Average Family Size Correlation Summary
| Measurement | Luxembourger | Alaskan Athabascan |
| Minimum | 1.98 | 1.83 |
| Maximum | 3.40 | 6.79 |
| Range | 1.42 | 4.96 |
| Mean | 2.92 | 3.34 |
| Median | 2.98 | 3.21 |
| Interquartile 25% (IQ1) | 2.81 | 2.95 |
| Interquartile 75% (IQ3) | 3.09 | 3.50 |
| Interquartile Range (IQR) | 0.28 | 0.55 |
| Standard Deviation (Sample) | 0.30 | 0.82 |
| Standard Deviation (Population) | 0.30 | 0.82 |
Similar Demographics by Average Family Size
Demographics Similar to Luxembourgers by Average Family Size
In terms of average family size, the demographic groups most similar to Luxembourgers are Estonian (3.10, a difference of 0.030%), Lithuanian (3.10, a difference of 0.030%), Irish (3.10, a difference of 0.060%), Scotch-Irish (3.11, a difference of 0.080%), and Scottish (3.11, a difference of 0.080%).
| Demographics | Rating | Rank | Average Family Size |
| Czechs | 0.0 /100 | #328 | Tragic 3.11 |
| Belgians | 0.0 /100 | #329 | Tragic 3.11 |
| Latvians | 0.0 /100 | #330 | Tragic 3.11 |
| Scotch-Irish | 0.0 /100 | #331 | Tragic 3.11 |
| Scottish | 0.0 /100 | #332 | Tragic 3.11 |
| Estonians | 0.0 /100 | #333 | Tragic 3.10 |
| Lithuanians | 0.0 /100 | #334 | Tragic 3.10 |
| Luxembourgers | 0.0 /100 | #335 | Tragic 3.10 |
| Irish | 0.0 /100 | #336 | Tragic 3.10 |
| Swedes | 0.0 /100 | #337 | Tragic 3.10 |
| French | 0.0 /100 | #338 | Tragic 3.10 |
| Croatians | 0.0 /100 | #339 | Tragic 3.10 |
| Finns | 0.0 /100 | #340 | Tragic 3.09 |
| Poles | 0.0 /100 | #341 | Tragic 3.09 |
| Germans | 0.0 /100 | #342 | Tragic 3.09 |
Demographics Similar to Alaskan Athabascans by Average Family Size
In terms of average family size, the demographic groups most similar to Alaskan Athabascans are Immigrants from Colombia (3.27, a difference of 0.020%), South American Indian (3.26, a difference of 0.050%), Immigrants from Thailand (3.27, a difference of 0.060%), Immigrants from Cuba (3.26, a difference of 0.070%), and Immigrants from Bahamas (3.27, a difference of 0.080%).
| Demographics | Rating | Rank | Average Family Size |
| Immigrants | South America | 95.0 /100 | #116 | Exceptional 3.27 |
| Kiowa | 94.8 /100 | #117 | Exceptional 3.27 |
| Immigrants | Asia | 94.0 /100 | #118 | Exceptional 3.27 |
| Immigrants | Indonesia | 93.7 /100 | #119 | Exceptional 3.27 |
| Immigrants | Bahamas | 93.6 /100 | #120 | Exceptional 3.27 |
| Immigrants | Thailand | 93.3 /100 | #121 | Exceptional 3.27 |
| Immigrants | Colombia | 92.8 /100 | #122 | Exceptional 3.27 |
| Alaskan Athabascans | 92.4 /100 | #123 | Exceptional 3.27 |
| South American Indians | 91.6 /100 | #124 | Exceptional 3.26 |
| Immigrants | Cuba | 91.3 /100 | #125 | Exceptional 3.26 |
| Immigrants | Costa Rica | 90.7 /100 | #126 | Exceptional 3.26 |
| Immigrants | Syria | 90.6 /100 | #127 | Exceptional 3.26 |
| Colombians | 89.9 /100 | #128 | Excellent 3.26 |
| Immigrants | Hong Kong | 88.6 /100 | #129 | Excellent 3.26 |
| Laotians | 88.5 /100 | #130 | Excellent 3.26 |