Albanian vs Immigrants from Denmark Average Family Size
COMPARE
Albanian
Immigrants from Denmark
Average Family Size
Average Family Size Comparison
Albanians
Immigrants from Denmark
3.17
AVERAGE FAMILY SIZE
1.5/ 100
METRIC RATING
257th/ 347
METRIC RANK
3.15
AVERAGE FAMILY SIZE
0.4/ 100
METRIC RATING
281st/ 347
METRIC RANK
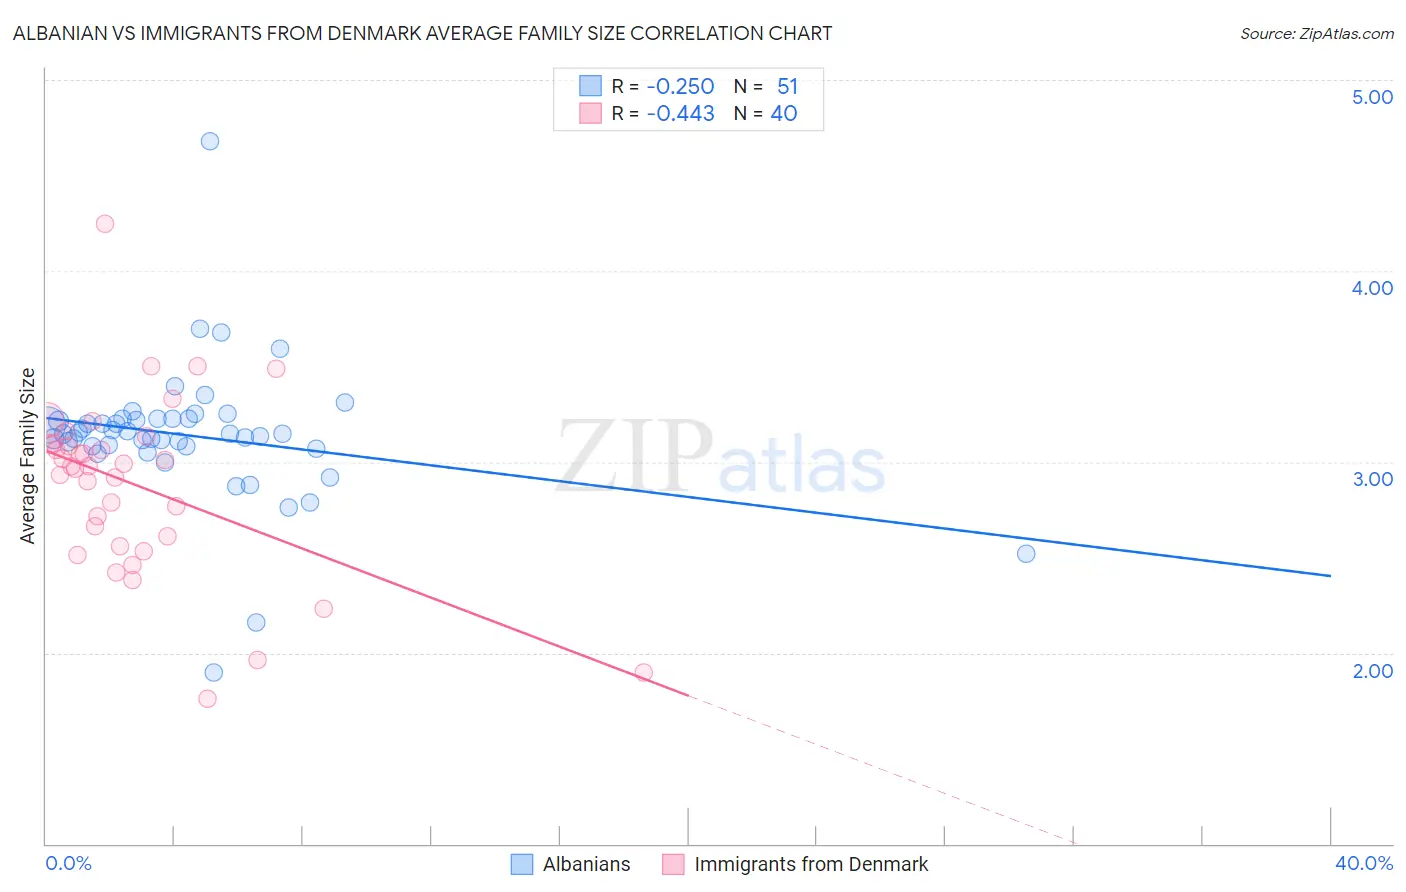
Albanian vs Immigrants from Denmark Average Family Size Correlation Chart
The statistical analysis conducted on geographies consisting of 193,186,402 people shows a weak negative correlation between the proportion of Albanians and average family size in the United States with a correlation coefficient (R) of -0.250 and weighted average of 3.17. Similarly, the statistical analysis conducted on geographies consisting of 136,403,907 people shows a moderate negative correlation between the proportion of Immigrants from Denmark and average family size in the United States with a correlation coefficient (R) of -0.443 and weighted average of 3.15, a difference of 0.62%.
Average Family Size Correlation Summary
| Measurement | Albanian | Immigrants from Denmark |
| Minimum | 1.90 | 1.76 |
| Maximum | 4.68 | 4.25 |
| Range | 2.78 | 2.49 |
| Mean | 3.14 | 2.88 |
| Median | 3.15 | 2.98 |
| Interquartile 25% (IQ1) | 3.08 | 2.58 |
| Interquartile 75% (IQ3) | 3.22 | 3.10 |
| Interquartile Range (IQR) | 0.15 | 0.51 |
| Standard Deviation (Sample) | 0.37 | 0.47 |
| Standard Deviation (Population) | 0.37 | 0.46 |
Similar Demographics by Average Family Size
Demographics Similar to Albanians by Average Family Size
In terms of average family size, the demographic groups most similar to Albanians are Immigrants from Kazakhstan (3.17, a difference of 0.020%), Cape Verdean (3.17, a difference of 0.050%), Turkish (3.16, a difference of 0.050%), Potawatomi (3.16, a difference of 0.050%), and Immigrants from Hungary (3.17, a difference of 0.060%).
| Demographics | Rating | Rank | Average Family Size |
| Puget Sound Salish | 1.9 /100 | #250 | Tragic 3.17 |
| Immigrants | Spain | 1.8 /100 | #251 | Tragic 3.17 |
| Immigrants | Saudi Arabia | 1.7 /100 | #252 | Tragic 3.17 |
| South Africans | 1.7 /100 | #253 | Tragic 3.17 |
| Immigrants | Hungary | 1.7 /100 | #254 | Tragic 3.17 |
| Cape Verdeans | 1.6 /100 | #255 | Tragic 3.17 |
| Immigrants | Kazakhstan | 1.5 /100 | #256 | Tragic 3.17 |
| Albanians | 1.5 /100 | #257 | Tragic 3.17 |
| Turks | 1.3 /100 | #258 | Tragic 3.16 |
| Potawatomi | 1.3 /100 | #259 | Tragic 3.16 |
| Immigrants | Albania | 1.3 /100 | #260 | Tragic 3.16 |
| Immigrants | North Macedonia | 1.3 /100 | #261 | Tragic 3.16 |
| Immigrants | Russia | 1.3 /100 | #262 | Tragic 3.16 |
| Immigrants | Bulgaria | 1.0 /100 | #263 | Tragic 3.16 |
| Americans | 1.0 /100 | #264 | Tragic 3.16 |
Demographics Similar to Immigrants from Denmark by Average Family Size
In terms of average family size, the demographic groups most similar to Immigrants from Denmark are Yugoslavian (3.15, a difference of 0.010%), German Russian (3.15, a difference of 0.020%), Immigrants from England (3.15, a difference of 0.040%), Immigrants from France (3.15, a difference of 0.040%), and Immigrants from Europe (3.15, a difference of 0.060%).
| Demographics | Rating | Rank | Average Family Size |
| Immigrants | Belgium | 0.6 /100 | #274 | Tragic 3.15 |
| Cambodians | 0.6 /100 | #275 | Tragic 3.15 |
| Immigrants | Bosnia and Herzegovina | 0.5 /100 | #276 | Tragic 3.15 |
| Swiss | 0.5 /100 | #277 | Tragic 3.15 |
| Okinawans | 0.5 /100 | #278 | Tragic 3.15 |
| Immigrants | Europe | 0.5 /100 | #279 | Tragic 3.15 |
| Immigrants | England | 0.4 /100 | #280 | Tragic 3.15 |
| Immigrants | Denmark | 0.4 /100 | #281 | Tragic 3.15 |
| Yugoslavians | 0.4 /100 | #282 | Tragic 3.15 |
| German Russians | 0.4 /100 | #283 | Tragic 3.15 |
| Immigrants | France | 0.4 /100 | #284 | Tragic 3.15 |
| Whites/Caucasians | 0.3 /100 | #285 | Tragic 3.14 |
| Immigrants | Netherlands | 0.3 /100 | #286 | Tragic 3.14 |
| Greeks | 0.3 /100 | #287 | Tragic 3.14 |
| Immigrants | Czechoslovakia | 0.3 /100 | #288 | Tragic 3.14 |