Korean vs Immigrants from the Azores Receiving Food Stamps
COMPARE
Korean
Immigrants from the Azores
Receiving Food Stamps
Receiving Food Stamps Comparison
Koreans
Immigrants from the Azores
10.4%
RECEIVING FOOD STAMPS
96.3/ 100
METRIC RATING
107th/ 347
METRIC RANK
16.4%
RECEIVING FOOD STAMPS
0.0/ 100
METRIC RATING
305th/ 347
METRIC RANK
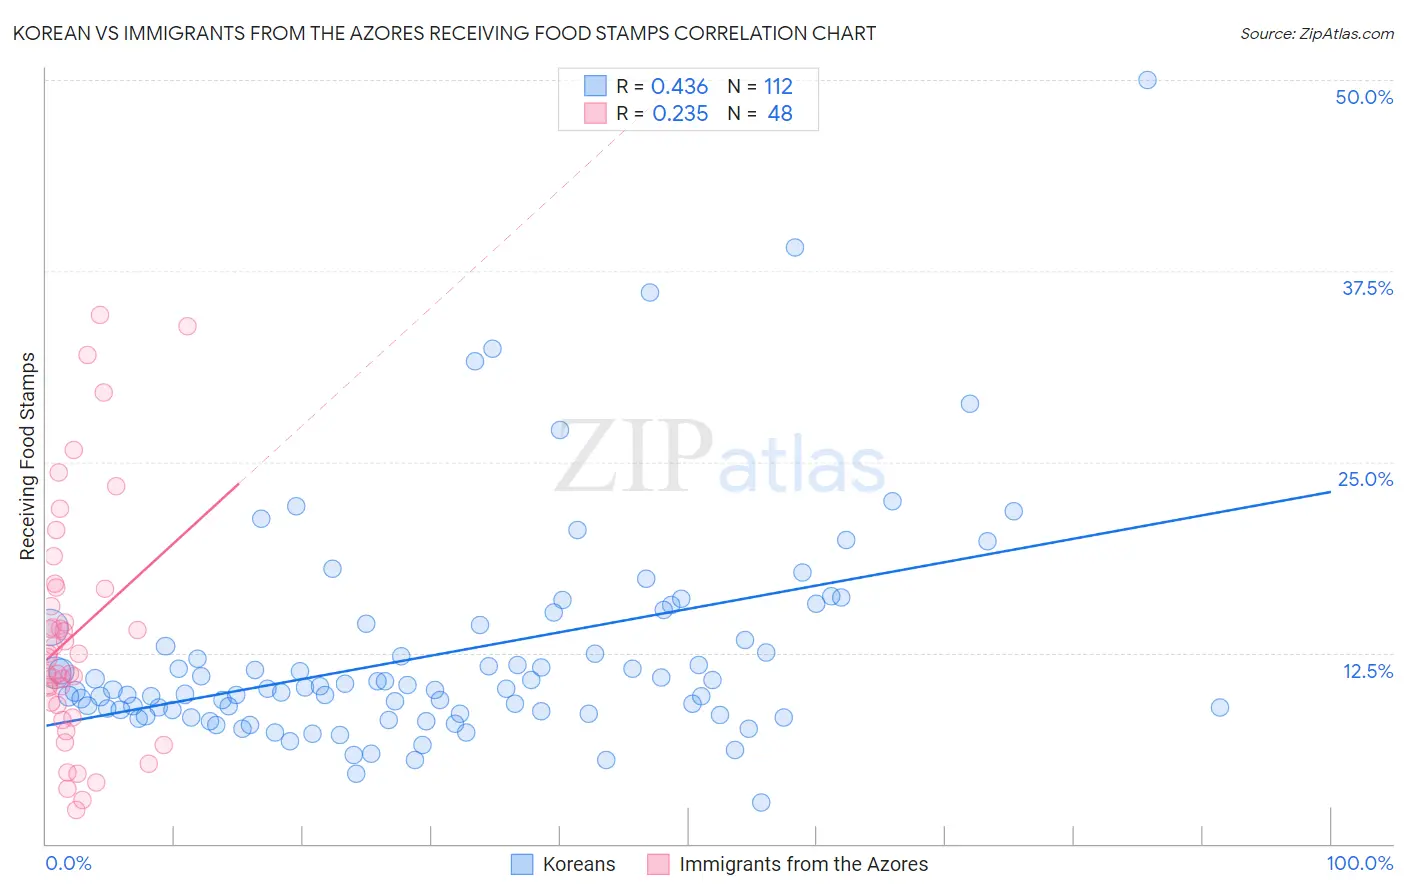
Korean vs Immigrants from the Azores Receiving Food Stamps Correlation Chart
The statistical analysis conducted on geographies consisting of 508,812,505 people shows a moderate positive correlation between the proportion of Koreans and percentage of population receiving government assistance and/or food stamps in the United States with a correlation coefficient (R) of 0.436 and weighted average of 10.4%. Similarly, the statistical analysis conducted on geographies consisting of 46,243,454 people shows a weak positive correlation between the proportion of Immigrants from the Azores and percentage of population receiving government assistance and/or food stamps in the United States with a correlation coefficient (R) of 0.235 and weighted average of 16.4%, a difference of 57.6%.
Receiving Food Stamps Correlation Summary
| Measurement | Korean | Immigrants from the Azores |
| Minimum | 2.7% | 2.2% |
| Maximum | 50.0% | 34.6% |
| Range | 47.3% | 32.4% |
| Mean | 12.5% | 13.7% |
| Median | 10.1% | 12.3% |
| Interquartile 25% (IQ1) | 8.6% | 8.7% |
| Interquartile 75% (IQ3) | 13.7% | 16.7% |
| Interquartile Range (IQR) | 5.1% | 8.1% |
| Standard Deviation (Sample) | 7.2% | 7.9% |
| Standard Deviation (Population) | 7.2% | 7.9% |
Similar Demographics by Receiving Food Stamps
Demographics Similar to Koreans by Receiving Food Stamps
In terms of receiving food stamps, the demographic groups most similar to Koreans are Carpatho Rusyn (10.4%, a difference of 0.030%), Immigrants from Pakistan (10.4%, a difference of 0.080%), Immigrants from Italy (10.4%, a difference of 0.15%), Immigrants from Malaysia (10.4%, a difference of 0.24%), and Pakistani (10.4%, a difference of 0.36%).
| Demographics | Rating | Rank | Receiving Food Stamps |
| Immigrants | Western Europe | 96.9 /100 | #100 | Exceptional 10.3% |
| Palestinians | 96.9 /100 | #101 | Exceptional 10.3% |
| Immigrants | Europe | 96.8 /100 | #102 | Exceptional 10.3% |
| Immigrants | Latvia | 96.8 /100 | #103 | Exceptional 10.3% |
| Immigrants | Hungary | 96.7 /100 | #104 | Exceptional 10.3% |
| Immigrants | Malaysia | 96.5 /100 | #105 | Exceptional 10.4% |
| Immigrants | Italy | 96.4 /100 | #106 | Exceptional 10.4% |
| Koreans | 96.3 /100 | #107 | Exceptional 10.4% |
| Carpatho Rusyns | 96.2 /100 | #108 | Exceptional 10.4% |
| Immigrants | Pakistan | 96.2 /100 | #109 | Exceptional 10.4% |
| Pakistanis | 95.9 /100 | #110 | Exceptional 10.4% |
| Romanians | 95.8 /100 | #111 | Exceptional 10.4% |
| Mongolians | 95.8 /100 | #112 | Exceptional 10.5% |
| Icelanders | 95.4 /100 | #113 | Exceptional 10.5% |
| Scotch-Irish | 95.1 /100 | #114 | Exceptional 10.5% |
Demographics Similar to Immigrants from the Azores by Receiving Food Stamps
In terms of receiving food stamps, the demographic groups most similar to Immigrants from the Azores are Jamaican (16.4%, a difference of 0.070%), Houma (16.5%, a difference of 0.35%), Barbadian (16.5%, a difference of 0.62%), U.S. Virgin Islander (16.5%, a difference of 0.86%), and West Indian (16.3%, a difference of 0.88%).
| Demographics | Rating | Rank | Receiving Food Stamps |
| Immigrants | Trinidad and Tobago | 0.0 /100 | #298 | Tragic 15.8% |
| Hispanics or Latinos | 0.0 /100 | #299 | Tragic 15.8% |
| Immigrants | Bangladesh | 0.0 /100 | #300 | Tragic 15.9% |
| Trinidadians and Tobagonians | 0.0 /100 | #301 | Tragic 16.0% |
| Immigrants | West Indies | 0.0 /100 | #302 | Tragic 16.1% |
| Nicaraguans | 0.0 /100 | #303 | Tragic 16.1% |
| West Indians | 0.0 /100 | #304 | Tragic 16.3% |
| Immigrants | Azores | 0.0 /100 | #305 | Tragic 16.4% |
| Jamaicans | 0.0 /100 | #306 | Tragic 16.4% |
| Houma | 0.0 /100 | #307 | Tragic 16.5% |
| Barbadians | 0.0 /100 | #308 | Tragic 16.5% |
| U.S. Virgin Islanders | 0.0 /100 | #309 | Tragic 16.5% |
| Immigrants | Barbados | 0.0 /100 | #310 | Tragic 16.6% |
| Guyanese | 0.0 /100 | #311 | Tragic 16.7% |
| Sioux | 0.0 /100 | #312 | Tragic 16.8% |