Belgian vs Immigrants from the Azores Currently Married
COMPARE
Belgian
Immigrants from the Azores
Currently Married
Currently Married Comparison
Belgians
Immigrants from the Azores
48.7%
CURRENTLY MARRIED
99.3/ 100
METRIC RATING
45th/ 347
METRIC RANK
45.1%
CURRENTLY MARRIED
2.5/ 100
METRIC RATING
222nd/ 347
METRIC RANK
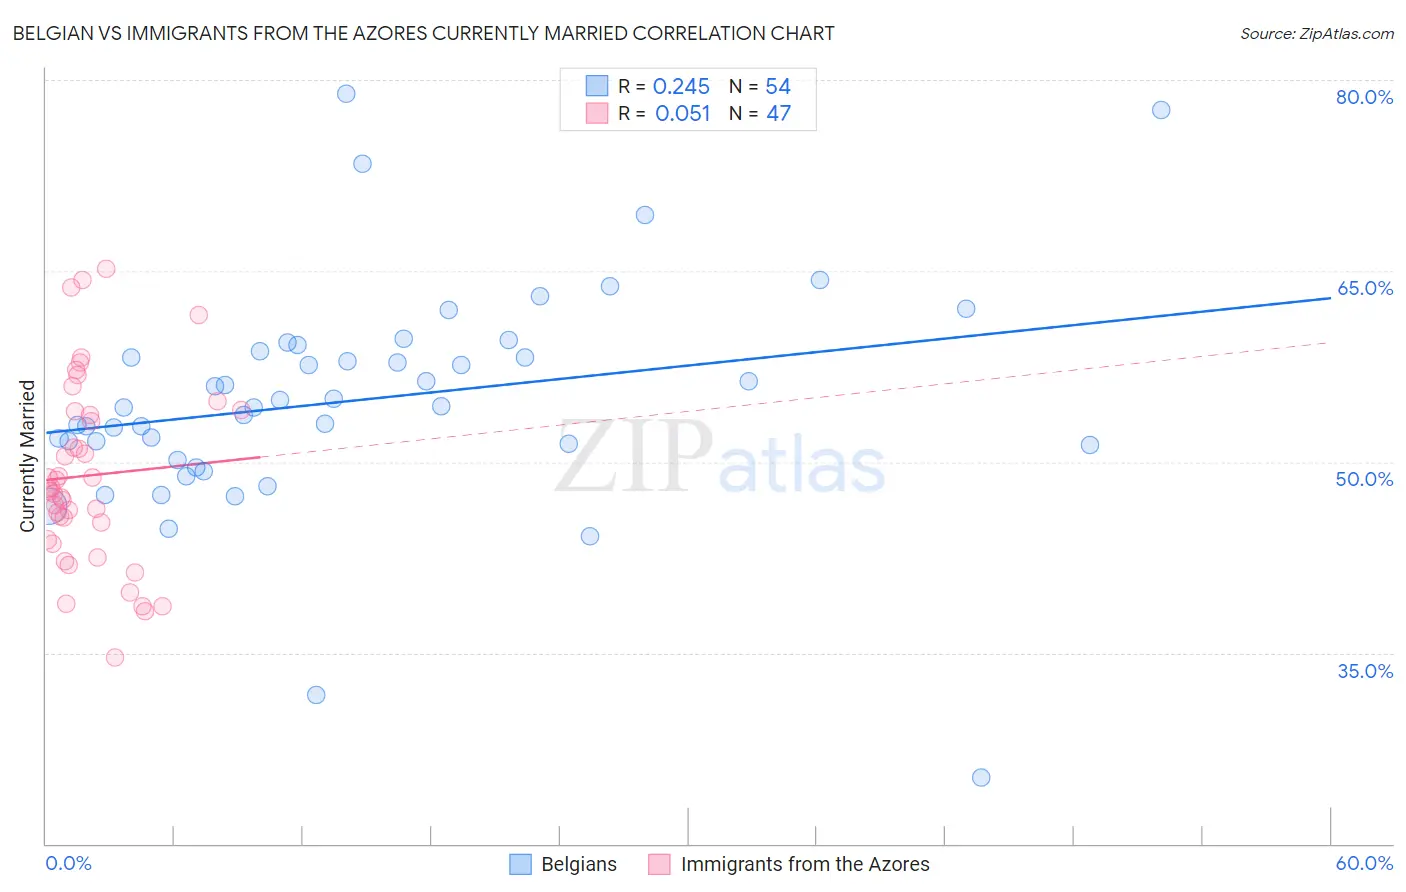
Belgian vs Immigrants from the Azores Currently Married Correlation Chart
The statistical analysis conducted on geographies consisting of 355,993,488 people shows a weak positive correlation between the proportion of Belgians and percentage of population currently married in the United States with a correlation coefficient (R) of 0.245 and weighted average of 48.7%. Similarly, the statistical analysis conducted on geographies consisting of 46,256,915 people shows a slight positive correlation between the proportion of Immigrants from the Azores and percentage of population currently married in the United States with a correlation coefficient (R) of 0.051 and weighted average of 45.1%, a difference of 8.1%.
Currently Married Correlation Summary
| Measurement | Belgian | Immigrants from the Azores |
| Minimum | 25.2% | 34.6% |
| Maximum | 78.9% | 65.2% |
| Range | 53.7% | 30.6% |
| Mean | 54.9% | 48.9% |
| Median | 54.3% | 47.9% |
| Interquartile 25% (IQ1) | 51.3% | 43.9% |
| Interquartile 75% (IQ3) | 58.7% | 54.0% |
| Interquartile Range (IQR) | 7.4% | 10.1% |
| Standard Deviation (Sample) | 9.0% | 7.2% |
| Standard Deviation (Population) | 8.9% | 7.2% |
Similar Demographics by Currently Married
Demographics Similar to Belgians by Currently Married
In terms of currently married, the demographic groups most similar to Belgians are Immigrants from North America (48.7%, a difference of 0.030%), Immigrants from Iran (48.7%, a difference of 0.030%), Northern European (48.7%, a difference of 0.040%), Austrian (48.7%, a difference of 0.050%), and Finnish (48.8%, a difference of 0.060%).
| Demographics | Rating | Rank | Currently Married |
| Czechoslovakians | 99.4 /100 | #38 | Exceptional 48.8% |
| British | 99.4 /100 | #39 | Exceptional 48.8% |
| Immigrants | Canada | 99.4 /100 | #40 | Exceptional 48.8% |
| Greeks | 99.3 /100 | #41 | Exceptional 48.8% |
| Finns | 99.3 /100 | #42 | Exceptional 48.8% |
| Scotch-Irish | 99.3 /100 | #43 | Exceptional 48.7% |
| Immigrants | North America | 99.3 /100 | #44 | Exceptional 48.7% |
| Belgians | 99.3 /100 | #45 | Exceptional 48.7% |
| Immigrants | Iran | 99.2 /100 | #46 | Exceptional 48.7% |
| Northern Europeans | 99.2 /100 | #47 | Exceptional 48.7% |
| Austrians | 99.2 /100 | #48 | Exceptional 48.7% |
| Bhutanese | 99.1 /100 | #49 | Exceptional 48.6% |
| Iranians | 99.0 /100 | #50 | Exceptional 48.6% |
| Whites/Caucasians | 99.0 /100 | #51 | Exceptional 48.6% |
| Russians | 98.9 /100 | #52 | Exceptional 48.6% |
Demographics Similar to Immigrants from the Azores by Currently Married
In terms of currently married, the demographic groups most similar to Immigrants from the Azores are Immigrants from Laos (45.0%, a difference of 0.080%), Immigrants from Uganda (45.0%, a difference of 0.13%), French American Indian (45.0%, a difference of 0.13%), Comanche (45.0%, a difference of 0.18%), and Spanish American (45.0%, a difference of 0.18%).
| Demographics | Rating | Rank | Currently Married |
| German Russians | 6.7 /100 | #215 | Tragic 45.5% |
| Immigrants | Morocco | 5.5 /100 | #216 | Tragic 45.4% |
| Immigrants | Thailand | 5.1 /100 | #217 | Tragic 45.4% |
| Panamanians | 4.0 /100 | #218 | Tragic 45.3% |
| Immigrants | Portugal | 3.5 /100 | #219 | Tragic 45.2% |
| Kenyans | 3.1 /100 | #220 | Tragic 45.2% |
| Mexicans | 3.0 /100 | #221 | Tragic 45.2% |
| Immigrants | Azores | 2.5 /100 | #222 | Tragic 45.1% |
| Immigrants | Laos | 2.3 /100 | #223 | Tragic 45.0% |
| Immigrants | Uganda | 2.2 /100 | #224 | Tragic 45.0% |
| French American Indians | 2.2 /100 | #225 | Tragic 45.0% |
| Comanche | 2.1 /100 | #226 | Tragic 45.0% |
| Spanish Americans | 2.1 /100 | #227 | Tragic 45.0% |
| Immigrants | Uruguay | 2.0 /100 | #228 | Tragic 45.0% |
| Cree | 1.7 /100 | #229 | Tragic 44.9% |