Yaqui vs Immigrants from the Azores Currently Married
COMPARE
Yaqui
Immigrants from the Azores
Currently Married
Currently Married Comparison
Yaqui
Immigrants from the Azores
43.4%
CURRENTLY MARRIED
0.1/ 100
METRIC RATING
273rd/ 347
METRIC RANK
45.1%
CURRENTLY MARRIED
2.5/ 100
METRIC RATING
222nd/ 347
METRIC RANK
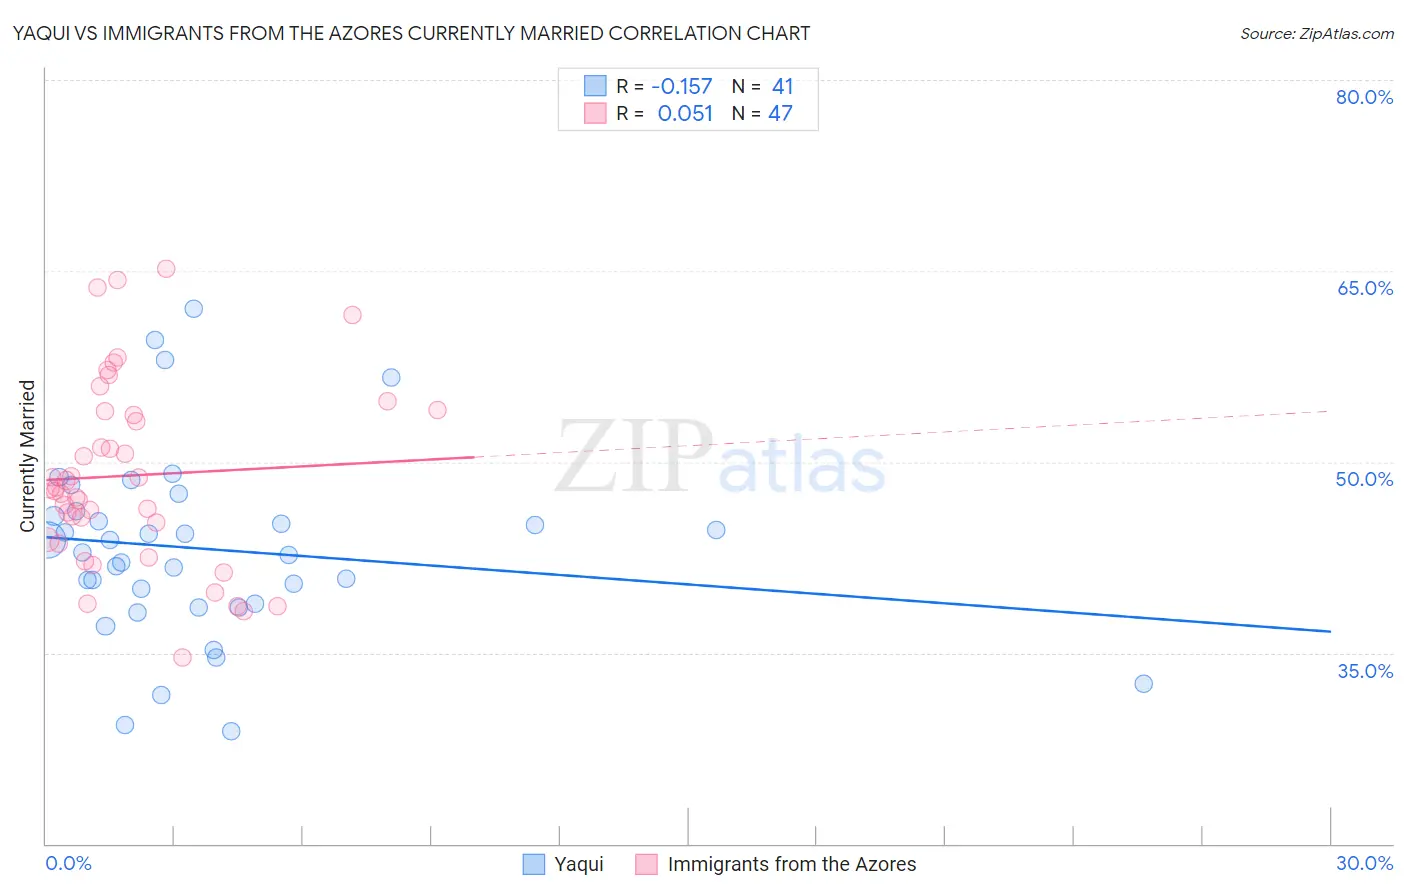
Yaqui vs Immigrants from the Azores Currently Married Correlation Chart
The statistical analysis conducted on geographies consisting of 107,738,640 people shows a poor negative correlation between the proportion of Yaqui and percentage of population currently married in the United States with a correlation coefficient (R) of -0.157 and weighted average of 43.4%. Similarly, the statistical analysis conducted on geographies consisting of 46,256,915 people shows a slight positive correlation between the proportion of Immigrants from the Azores and percentage of population currently married in the United States with a correlation coefficient (R) of 0.051 and weighted average of 45.1%, a difference of 3.7%.
Currently Married Correlation Summary
| Measurement | Yaqui | Immigrants from the Azores |
| Minimum | 28.9% | 34.6% |
| Maximum | 62.0% | 65.2% |
| Range | 33.1% | 30.6% |
| Mean | 43.1% | 48.9% |
| Median | 42.9% | 47.9% |
| Interquartile 25% (IQ1) | 38.7% | 43.9% |
| Interquartile 75% (IQ3) | 45.9% | 54.0% |
| Interquartile Range (IQR) | 7.2% | 10.1% |
| Standard Deviation (Sample) | 7.3% | 7.2% |
| Standard Deviation (Population) | 7.2% | 7.2% |
Similar Demographics by Currently Married
Demographics Similar to Yaqui by Currently Married
In terms of currently married, the demographic groups most similar to Yaqui are Nigerian (43.4%, a difference of 0.020%), Indonesian (43.5%, a difference of 0.040%), Colville (43.4%, a difference of 0.040%), Sierra Leonean (43.4%, a difference of 0.070%), and Immigrants from Nigeria (43.4%, a difference of 0.070%).
| Demographics | Rating | Rank | Currently Married |
| Ecuadorians | 0.1 /100 | #266 | Tragic 43.6% |
| Immigrants | Eritrea | 0.1 /100 | #267 | Tragic 43.6% |
| Spanish American Indians | 0.1 /100 | #268 | Tragic 43.6% |
| Immigrants | Sudan | 0.1 /100 | #269 | Tragic 43.5% |
| Salvadorans | 0.1 /100 | #270 | Tragic 43.5% |
| Bermudans | 0.1 /100 | #271 | Tragic 43.5% |
| Indonesians | 0.1 /100 | #272 | Tragic 43.5% |
| Yaqui | 0.1 /100 | #273 | Tragic 43.4% |
| Nigerians | 0.1 /100 | #274 | Tragic 43.4% |
| Colville | 0.1 /100 | #275 | Tragic 43.4% |
| Sierra Leoneans | 0.1 /100 | #276 | Tragic 43.4% |
| Immigrants | Nigeria | 0.1 /100 | #277 | Tragic 43.4% |
| Central Americans | 0.0 /100 | #278 | Tragic 43.3% |
| Central American Indians | 0.0 /100 | #279 | Tragic 43.3% |
| Apache | 0.0 /100 | #280 | Tragic 43.2% |
Demographics Similar to Immigrants from the Azores by Currently Married
In terms of currently married, the demographic groups most similar to Immigrants from the Azores are Immigrants from Laos (45.0%, a difference of 0.080%), Immigrants from Uganda (45.0%, a difference of 0.13%), French American Indian (45.0%, a difference of 0.13%), Comanche (45.0%, a difference of 0.18%), and Spanish American (45.0%, a difference of 0.18%).
| Demographics | Rating | Rank | Currently Married |
| German Russians | 6.7 /100 | #215 | Tragic 45.5% |
| Immigrants | Morocco | 5.5 /100 | #216 | Tragic 45.4% |
| Immigrants | Thailand | 5.1 /100 | #217 | Tragic 45.4% |
| Panamanians | 4.0 /100 | #218 | Tragic 45.3% |
| Immigrants | Portugal | 3.5 /100 | #219 | Tragic 45.2% |
| Kenyans | 3.1 /100 | #220 | Tragic 45.2% |
| Mexicans | 3.0 /100 | #221 | Tragic 45.2% |
| Immigrants | Azores | 2.5 /100 | #222 | Tragic 45.1% |
| Immigrants | Laos | 2.3 /100 | #223 | Tragic 45.0% |
| Immigrants | Uganda | 2.2 /100 | #224 | Tragic 45.0% |
| French American Indians | 2.2 /100 | #225 | Tragic 45.0% |
| Comanche | 2.1 /100 | #226 | Tragic 45.0% |
| Spanish Americans | 2.1 /100 | #227 | Tragic 45.0% |
| Immigrants | Uruguay | 2.0 /100 | #228 | Tragic 45.0% |
| Cree | 1.7 /100 | #229 | Tragic 44.9% |