Korean vs Immigrants from the Azores Bachelor's Degree
COMPARE
Korean
Immigrants from the Azores
Bachelor's Degree
Bachelor's Degree Comparison
Koreans
Immigrants from the Azores
37.0%
BACHELOR'S DEGREE
29.8/ 100
METRIC RATING
195th/ 347
METRIC RANK
27.3%
BACHELOR'S DEGREE
0.0/ 100
METRIC RATING
331st/ 347
METRIC RANK
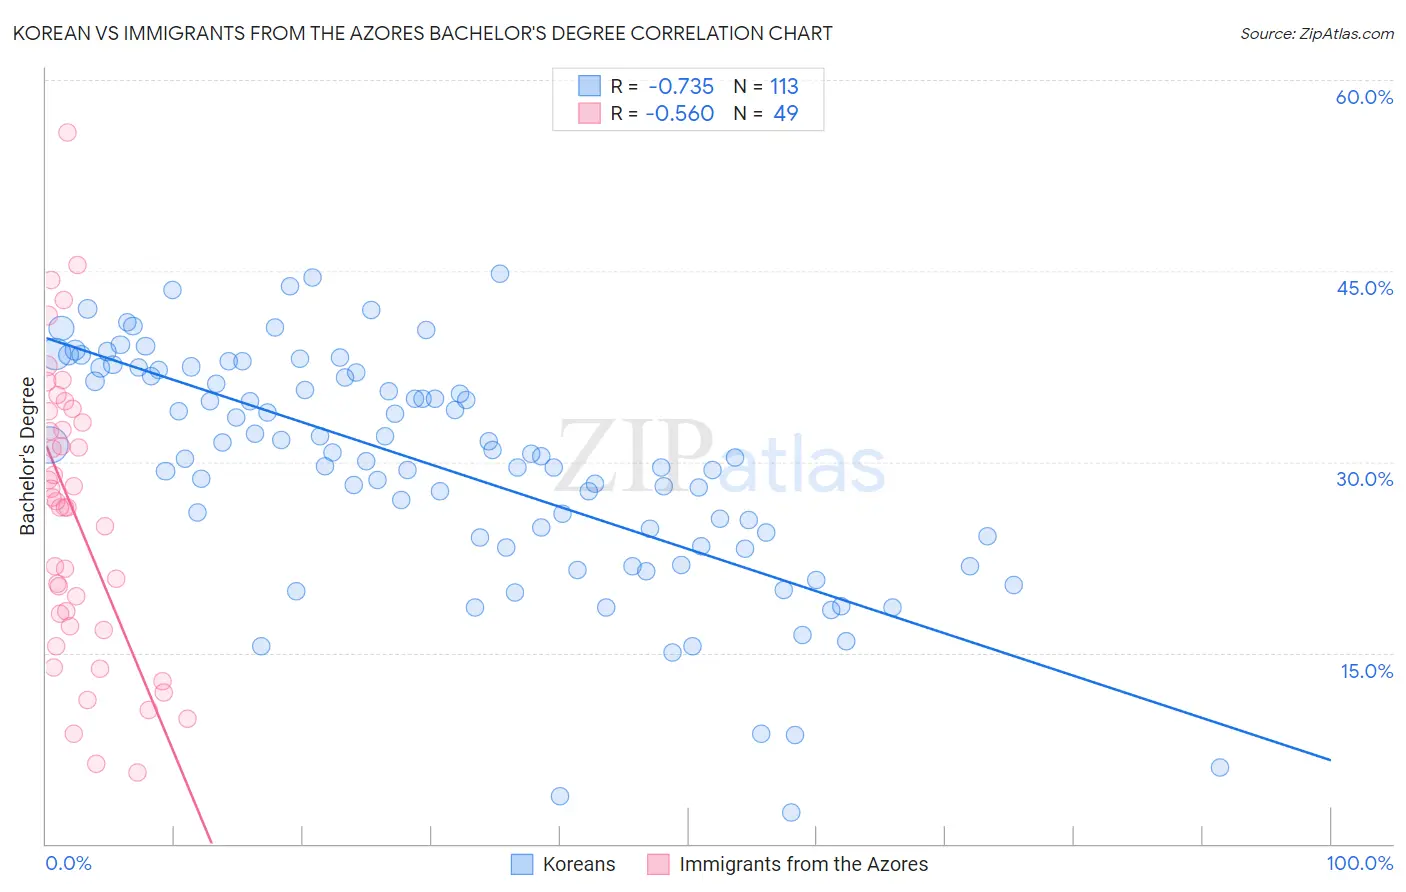
Korean vs Immigrants from the Azores Bachelor's Degree Correlation Chart
The statistical analysis conducted on geographies consisting of 510,872,242 people shows a strong negative correlation between the proportion of Koreans and percentage of population with at least bachelor's degree education in the United States with a correlation coefficient (R) of -0.735 and weighted average of 37.0%. Similarly, the statistical analysis conducted on geographies consisting of 46,257,310 people shows a substantial negative correlation between the proportion of Immigrants from the Azores and percentage of population with at least bachelor's degree education in the United States with a correlation coefficient (R) of -0.560 and weighted average of 27.3%, a difference of 35.5%.
Bachelor's Degree Correlation Summary
| Measurement | Korean | Immigrants from the Azores |
| Minimum | 2.5% | 5.6% |
| Maximum | 44.8% | 55.9% |
| Range | 42.3% | 50.3% |
| Mean | 29.6% | 25.6% |
| Median | 30.4% | 26.4% |
| Interquartile 25% (IQ1) | 23.7% | 16.9% |
| Interquartile 75% (IQ3) | 36.9% | 33.6% |
| Interquartile Range (IQR) | 13.2% | 16.6% |
| Standard Deviation (Sample) | 9.0% | 11.2% |
| Standard Deviation (Population) | 9.0% | 11.1% |
Similar Demographics by Bachelor's Degree
Demographics Similar to Koreans by Bachelor's Degree
In terms of bachelor's degree, the demographic groups most similar to Koreans are Belgian (37.0%, a difference of 0.010%), Celtic (37.0%, a difference of 0.030%), Czechoslovakian (37.0%, a difference of 0.070%), Welsh (37.0%, a difference of 0.080%), and Yugoslavian (37.1%, a difference of 0.20%).
| Demographics | Rating | Rank | Bachelor's Degree |
| Immigrants | Oceania | 37.3 /100 | #188 | Fair 37.3% |
| Slovaks | 36.9 /100 | #189 | Fair 37.3% |
| Swiss | 34.1 /100 | #190 | Fair 37.2% |
| Nigerians | 33.9 /100 | #191 | Fair 37.2% |
| Immigrants | Vietnam | 32.1 /100 | #192 | Fair 37.1% |
| Yugoslavians | 31.5 /100 | #193 | Fair 37.1% |
| Belgians | 29.9 /100 | #194 | Fair 37.0% |
| Koreans | 29.8 /100 | #195 | Fair 37.0% |
| Celtics | 29.5 /100 | #196 | Fair 37.0% |
| Czechoslovakians | 29.2 /100 | #197 | Fair 37.0% |
| Welsh | 29.1 /100 | #198 | Fair 37.0% |
| Immigrants | Costa Rica | 27.4 /100 | #199 | Fair 36.9% |
| Immigrants | Ghana | 27.4 /100 | #200 | Fair 36.9% |
| Immigrants | South Eastern Asia | 25.4 /100 | #201 | Fair 36.8% |
| Immigrants | Zaire | 25.3 /100 | #202 | Fair 36.8% |
Demographics Similar to Immigrants from the Azores by Bachelor's Degree
In terms of bachelor's degree, the demographic groups most similar to Immigrants from the Azores are Menominee (27.3%, a difference of 0.10%), Spanish American Indian (27.5%, a difference of 0.48%), Immigrants from Central America (27.5%, a difference of 0.54%), Mexican (27.1%, a difference of 0.92%), and Crow (27.7%, a difference of 1.5%).
| Demographics | Rating | Rank | Bachelor's Degree |
| Dutch West Indians | 0.0 /100 | #324 | Tragic 28.5% |
| Pennsylvania Germans | 0.0 /100 | #325 | Tragic 28.4% |
| Apache | 0.0 /100 | #326 | Tragic 28.3% |
| Paiute | 0.0 /100 | #327 | Tragic 28.1% |
| Crow | 0.0 /100 | #328 | Tragic 27.7% |
| Immigrants | Central America | 0.0 /100 | #329 | Tragic 27.5% |
| Spanish American Indians | 0.0 /100 | #330 | Tragic 27.5% |
| Immigrants | Azores | 0.0 /100 | #331 | Tragic 27.3% |
| Menominee | 0.0 /100 | #332 | Tragic 27.3% |
| Mexicans | 0.0 /100 | #333 | Tragic 27.1% |
| Arapaho | 0.0 /100 | #334 | Tragic 26.6% |
| Natives/Alaskans | 0.0 /100 | #335 | Tragic 26.3% |
| Immigrants | Mexico | 0.0 /100 | #336 | Tragic 26.1% |
| Inupiat | 0.0 /100 | #337 | Tragic 25.8% |
| Pueblo | 0.0 /100 | #338 | Tragic 25.5% |