Kiowa vs Immigrants from the Azores Currently Married

COMPARE

Kiowa
Race
Ancestry
AfghanAfricanAlaska NativeAlaskan AthabascanAlbanianAleutAlsatianAmericanApacheArabArapahoArgentineanArmenianAssyrian/Chaldean/SyriacAustralianAustrianBahamianBangladeshiBarbadianBasqueBelgianBelizeanBermudanBhutaneseBlackfeetBolivianBrazilianBritishBritish West IndianBulgarianBurmeseCajunCambodianCanadianCape VerdeanCarpatho RusynCelticCentral AmericanCentral American IndianCherokeeCheyenneChickasawChileanChineseChippewaChoctawColombianColvilleComancheCosta RicanCreeCreekCroatianCrowCubanCypriotCzechCzechoslovakianDanishDelawareDominicanDutchDutch West IndianEastern EuropeanEcuadorianEgyptianEnglishEstonianEthiopianEuropeanFijianFilipinoFinnishFrenchFrench American IndianFrench CanadianGermanGerman RussianGhanaianGreekGuamanian/ChamorroGuatemalanGuyaneseHaitianHmongHonduranHopiHoumaHungarianIcelanderIndian (Asian)IndonesianInupiatIranianIraqiIrishIroquoisIsraeliItalianJamaicanJapaneseJordanianKenyanKiowaKoreanLaotianLatvianLebaneseLiberianLithuanianLumbeeLuxembourgerMacedonianMalaysianMalteseMarshalleseMenomineeMexicanMexican American IndianMongolianMoroccanNative HawaiianNavajoNepaleseNew ZealanderNicaraguanNigerianNorthern EuropeanNorwegianOkinawanOsageOttawaPaiutePakistaniPalestinianPanamanianParaguayanPennsylvania GermanPeruvianPimaPolishPortuguesePotawatomiPuebloPuerto RicanPuget Sound SalishRomanianRussianSalvadoranSamoanScandinavianScotch-IrishScottishSeminoleSenegaleseSerbianShoshoneSierra LeoneanSiouxSlavicSlovakSloveneSomaliSouth AfricanSouth AmericanSouth American IndianSoviet UnionSpaniardSpanishSpanish AmericanSpanish American IndianSri LankanSubsaharan AfricanSudaneseSwedishSwissSyrianTaiwaneseThaiTlingit-HaidaTohono O'OdhamTonganTrinidadian and TobagonianTsimshianTurkishU.S. Virgin IslanderUgandanUkrainianUruguayanUteVenezuelanVietnameseWelshWest IndianYakamaYaquiYugoslavianYumanYup'ikZimbabwean
Immigration
NonimmigrantsImmigrantsAfghanistanAfricaAlbaniaArgentinaArmeniaAsiaAustraliaAustriaBahamasBangladeshBarbadosBelarusBelgiumBelizeBoliviaBosnia and HerzegovinaBrazilBulgariaBurma/MyanmarCabo VerdeCambodiaCameroonCanadaCaribbeanCentral AmericaChileChinaColombiaCongoCosta RicaCroatiaCubaCzechoslovakiaDenmarkDominicaDominican RepublicEastern AfricaEastern AsiaEastern EuropeEcuadorEgyptEl SalvadorEnglandEritreaEthiopiaEuropeFijiFranceGermanyGhanaGreeceGrenadaGuatemalaGuyanaHaitiHondurasHong KongHungaryIndiaIndonesiaIranIraqIrelandIsraelItalyJamaicaJapanJordanKazakhstanKenyaKoreaKuwaitLaosLatin AmericaLatviaLebanonLiberiaLithuaniaMalaysiaMexicoMicronesiaMiddle AfricaMoldovaMoroccoNepalNetherlandsNicaraguaNigeriaNorth AmericaNorth MacedoniaNorthern AfricaNorthern EuropeNorwayOceaniaPakistanPanamaPeruPhilippinesPolandPortugalRomaniaRussiaSaudi ArabiaScotlandSenegalSerbiaSierra LeoneSingaporeSomaliaSouth AfricaSouth AmericaSouth Central AsiaSouth Eastern AsiaSouthern EuropeSpainSri LankaSt. Vincent and the GrenadinesSudanSwedenSwitzerlandSyriaTaiwanThailandTrinidad and TobagoTurkeyUgandaUkraineUruguayUzbekistanVenezuelaVietnamWest IndiesWestern AfricaWestern AsiaWestern EuropeYemenZaireZimbabwe
Immigrants from the Azores
Race
Ancestry
AfghanAfricanAlaska NativeAlaskan AthabascanAlbanianAleutAlsatianAmericanApacheArabArapahoArgentineanArmenianAssyrian/Chaldean/SyriacAustralianAustrianBahamianBangladeshiBarbadianBasqueBelgianBelizeanBermudanBhutaneseBlackfeetBolivianBrazilianBritishBritish West IndianBulgarianBurmeseCajunCambodianCanadianCape VerdeanCarpatho RusynCelticCentral AmericanCentral American IndianCherokeeCheyenneChickasawChileanChineseChippewaChoctawColombianColvilleComancheCosta RicanCreeCreekCroatianCrowCubanCypriotCzechCzechoslovakianDanishDelawareDominicanDutchDutch West IndianEastern EuropeanEcuadorianEgyptianEnglishEstonianEthiopianEuropeanFijianFilipinoFinnishFrenchFrench American IndianFrench CanadianGermanGerman RussianGhanaianGreekGuamanian/ChamorroGuatemalanGuyaneseHaitianHmongHonduranHopiHoumaHungarianIcelanderIndian (Asian)IndonesianInupiatIranianIraqiIrishIroquoisIsraeliItalianJamaicanJapaneseJordanianKenyanKoreanLaotianLatvianLebaneseLiberianLithuanianLumbeeLuxembourgerMacedonianMalaysianMalteseMarshalleseMenomineeMexicanMexican American IndianMongolianMoroccanNative HawaiianNavajoNepaleseNew ZealanderNicaraguanNigerianNorthern EuropeanNorwegianOkinawanOsageOttawaPaiutePakistaniPalestinianPanamanianParaguayanPennsylvania GermanPeruvianPimaPolishPortuguesePotawatomiPuebloPuerto RicanPuget Sound SalishRomanianRussianSalvadoranSamoanScandinavianScotch-IrishScottishSeminoleSenegaleseSerbianShoshoneSierra LeoneanSiouxSlavicSlovakSloveneSomaliSouth AfricanSouth AmericanSouth American IndianSoviet UnionSpaniardSpanishSpanish AmericanSpanish American IndianSri LankanSubsaharan AfricanSudaneseSwedishSwissSyrianTaiwaneseThaiTlingit-HaidaTohono O'OdhamTonganTrinidadian and TobagonianTsimshianTurkishU.S. Virgin IslanderUgandanUkrainianUruguayanUteVenezuelanVietnameseWelshWest IndianYakamaYaquiYugoslavianYumanYup'ikZimbabwean
Immigration
NonimmigrantsImmigrantsAfghanistanAfricaAlbaniaArgentinaArmeniaAsiaAustraliaAustriaBahamasBangladeshBarbadosBelarusBelgiumBelizeBoliviaBosnia and HerzegovinaBrazilBulgariaBurma/MyanmarCabo VerdeCambodiaCameroonCanadaCaribbeanCentral AmericaChileChinaColombiaCongoCosta RicaCroatiaCubaCzechoslovakiaDenmarkDominicaDominican RepublicEastern AfricaEastern AsiaEastern EuropeEcuadorEgyptEl SalvadorEnglandEritreaEthiopiaEuropeFijiFranceGermanyGhanaGreeceGrenadaGuatemalaGuyanaHaitiHondurasHong KongHungaryIndiaIndonesiaIranIraqIrelandIsraelItalyJamaicaJapanJordanKazakhstanKenyaKoreaKuwaitLaosLatin AmericaLatviaLebanonLiberiaLithuaniaMalaysiaMexicoMicronesiaMiddle AfricaMoldovaMoroccoNepalNetherlandsNicaraguaNigeriaNorth AmericaNorth MacedoniaNorthern AfricaNorthern EuropeNorwayOceaniaPakistanPanamaPeruPhilippinesPolandPortugalRomaniaRussiaSaudi ArabiaScotlandSenegalSerbiaSierra LeoneSingaporeSomaliaSouth AfricaSouth AmericaSouth Central AsiaSouth Eastern AsiaSouthern EuropeSpainSri LankaSt. Vincent and the GrenadinesSudanSwedenSwitzerlandSyriaTaiwanThailandTrinidad and TobagoTurkeyUgandaUkraineUruguayUzbekistanVenezuelaVietnamWest IndiesWestern AfricaWestern AsiaWestern EuropeYemenZaireZimbabweAzores
Currently Married
Income
Poverty
Unemployment
Labor Participation
Family Structure
Vehicle Availability
Education Level
Disability

Currently Married Comparison

Kiowa

Immigrants from the Azores

Tragic
Tragic
43.2%
CURRENTLY MARRIED
0.0/ 100
METRIC RATING
283rd/ 347
METRIC RANK
45.1%
CURRENTLY MARRIED
2.5/ 100
METRIC RATING
222nd/ 347
METRIC RANK

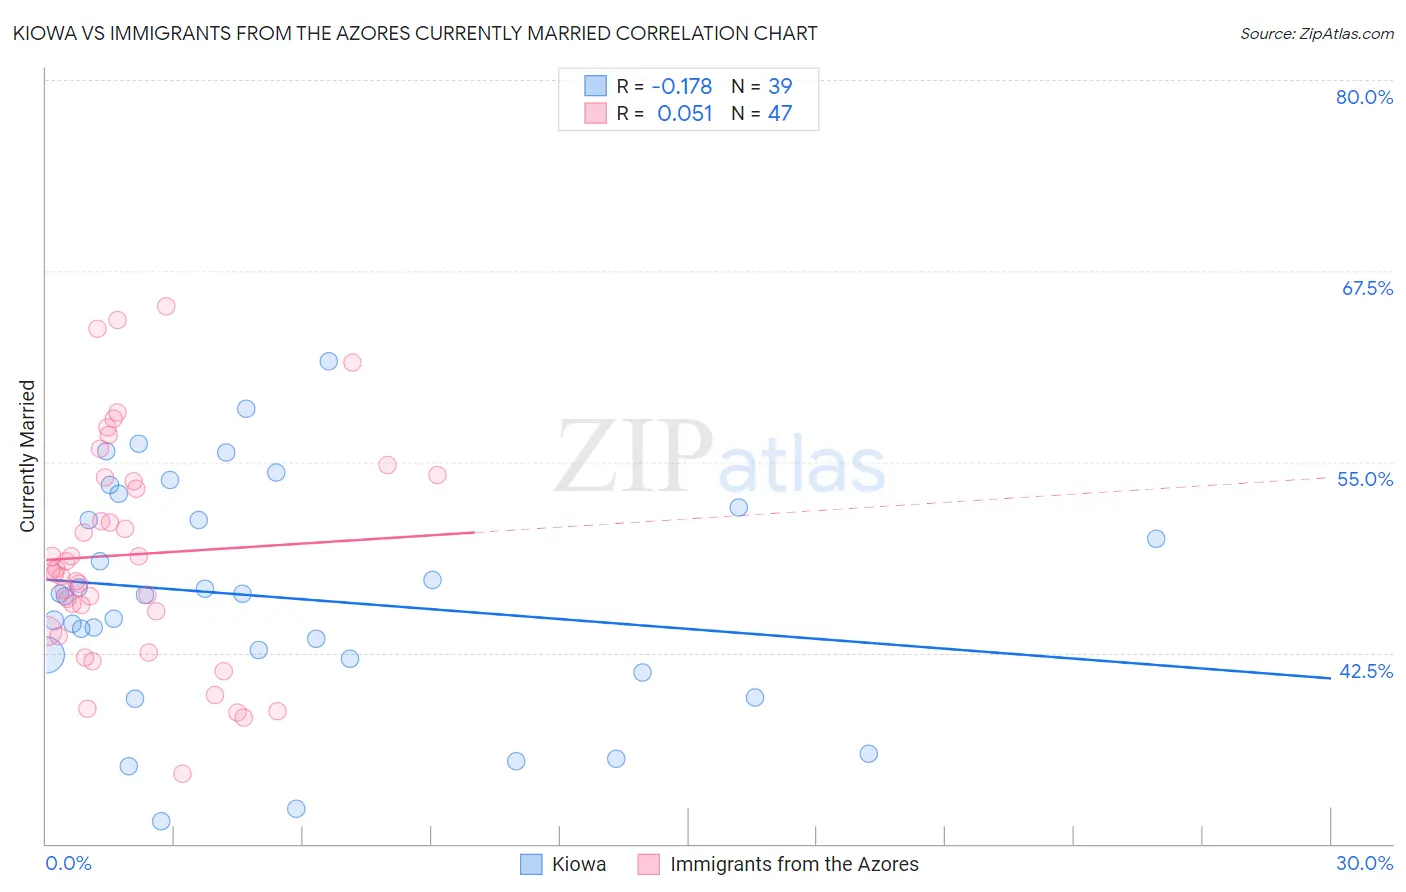
Kiowa vs Immigrants from the Azores Currently Married Correlation Chart

The statistical analysis conducted on geographies consisting of 56,101,122 people shows a poor negative correlation between the proportion of Kiowa and percentage of population currently married in the United States with a correlation coefficient (R) of -0.178 and weighted average of 43.2%. Similarly, the statistical analysis conducted on geographies consisting of 46,256,915 people shows a slight positive correlation between the proportion of Immigrants from the Azores and percentage of population currently married in the United States with a correlation coefficient (R) of 0.051 and weighted average of 45.1%, a difference of 4.4%.
Kiowa vs Immigrants from the Azores Currently Married

Currently Married Correlation Summary

MeasurementKiowaImmigrants from the Azores
Minimum31.5%34.6%
Maximum61.6%65.2%
Range30.1%30.6%
Mean46.1%48.9%
Median46.3%47.9%
Interquartile 25% (IQ1)42.1%43.9%
Interquartile 75% (IQ3)52.0%54.0%
Interquartile Range (IQR)9.9%10.1%
Standard Deviation (Sample)7.3%7.2%
Standard Deviation (Population)7.2%7.2%

Similar Demographics by Currently Married

Demographics Similar to Kiowa by Currently Married

In terms of currently married, the demographic groups most similar to Kiowa are Immigrants from El Salvador (43.1%, a difference of 0.010%), Immigrants from Ecuador (43.2%, a difference of 0.11%), Apache (43.2%, a difference of 0.19%), Chippewa (43.2%, a difference of 0.19%), and Central American Indian (43.3%, a difference of 0.27%).
DemographicsRating | RankCurrently Married
Sierra Leoneans
0.1
/100
|
#276
Tragic
43.4%
Immigrants | Nigeria
0.1
/100
|
#277
Tragic
43.4%
Central Americans
0.0
/100
|
#278
Tragic
43.3%
Central American Indians
0.0
/100
|
#279
Tragic
43.3%
Apache
0.0
/100
|
#280
Tragic
43.2%
Chippewa
0.0
/100
|
#281
Tragic
43.2%
Immigrants | Ecuador
0.0
/100
|
#282
Tragic
43.2%
Kiowa
0.0
/100
|
#283
Tragic
43.2%
Immigrants | El Salvador
0.0
/100
|
#284
Tragic
43.1%
Immigrants | Middle Africa
0.0
/100
|
#285
Tragic
43.0%
Ghanaians
0.0
/100
|
#286
Tragic
42.9%
Guatemalans
0.0
/100
|
#287
Tragic
42.9%
Natives/Alaskans
0.0
/100
|
#288
Tragic
42.8%
Paiute
0.0
/100
|
#289
Tragic
42.7%
Immigrants | Ghana
0.0
/100
|
#290
Tragic
42.7%

Demographics Similar to Immigrants from the Azores by Currently Married

In terms of currently married, the demographic groups most similar to Immigrants from the Azores are Immigrants from Laos (45.0%, a difference of 0.080%), Immigrants from Uganda (45.0%, a difference of 0.13%), French American Indian (45.0%, a difference of 0.13%), Comanche (45.0%, a difference of 0.18%), and Spanish American (45.0%, a difference of 0.18%).
DemographicsRating | RankCurrently Married
German Russians
6.7
/100
|
#215
Tragic
45.5%
Immigrants | Morocco
5.5
/100
|
#216
Tragic
45.4%
Immigrants | Thailand
5.1
/100
|
#217
Tragic
45.4%
Panamanians
4.0
/100
|
#218
Tragic
45.3%
Immigrants | Portugal
3.5
/100
|
#219
Tragic
45.2%
Kenyans
3.1
/100
|
#220
Tragic
45.2%
Mexicans
3.0
/100
|
#221
Tragic
45.2%
Immigrants | Azores
2.5
/100
|
#222
Tragic
45.1%
Immigrants | Laos
2.3
/100
|
#223
Tragic
45.0%
Immigrants | Uganda
2.2
/100
|
#224
Tragic
45.0%
French American Indians
2.2
/100
|
#225
Tragic
45.0%
Comanche
2.1
/100
|
#226
Tragic
45.0%
Spanish Americans
2.1
/100
|
#227
Tragic
45.0%
Immigrants | Uruguay
2.0
/100
|
#228
Tragic
45.0%
Cree
1.7
/100
|
#229
Tragic
44.9%