Kiowa vs Lumbee Currently Married
COMPARE
Kiowa
Lumbee
Currently Married
Currently Married Comparison
Kiowa
Lumbee
43.2%
CURRENTLY MARRIED
0.0/ 100
METRIC RATING
283rd/ 347
METRIC RANK
39.8%
CURRENTLY MARRIED
0.0/ 100
METRIC RATING
335th/ 347
METRIC RANK
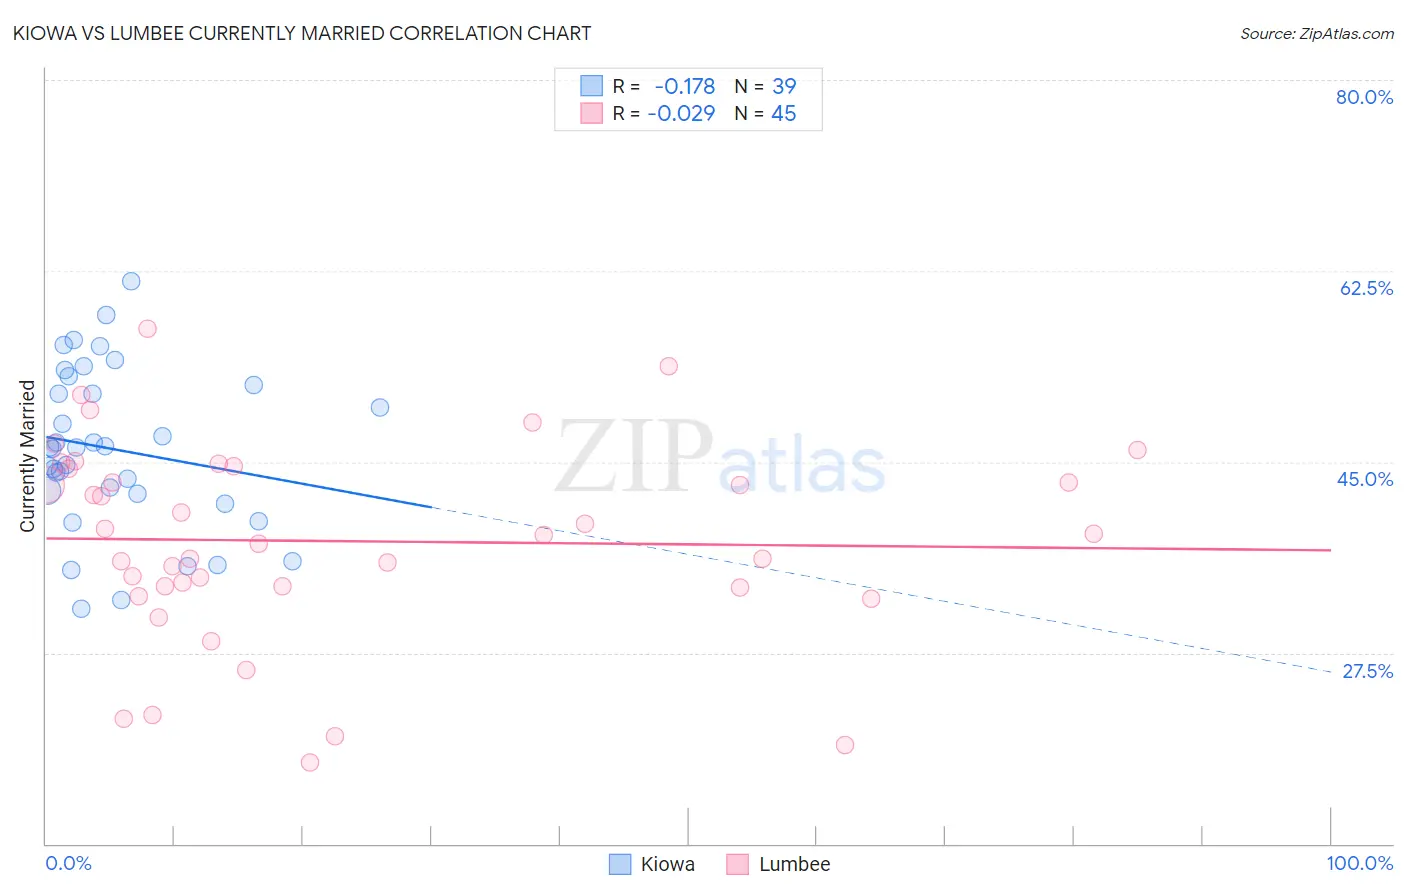
Kiowa vs Lumbee Currently Married Correlation Chart
The statistical analysis conducted on geographies consisting of 56,101,122 people shows a poor negative correlation between the proportion of Kiowa and percentage of population currently married in the United States with a correlation coefficient (R) of -0.178 and weighted average of 43.2%. Similarly, the statistical analysis conducted on geographies consisting of 92,298,299 people shows no correlation between the proportion of Lumbee and percentage of population currently married in the United States with a correlation coefficient (R) of -0.029 and weighted average of 39.8%, a difference of 8.3%.
Currently Married Correlation Summary
| Measurement | Kiowa | Lumbee |
| Minimum | 31.5% | 17.4% |
| Maximum | 61.6% | 57.2% |
| Range | 30.1% | 39.8% |
| Mean | 46.1% | 37.7% |
| Median | 46.3% | 38.3% |
| Interquartile 25% (IQ1) | 42.1% | 33.5% |
| Interquartile 75% (IQ3) | 52.0% | 44.5% |
| Interquartile Range (IQR) | 9.9% | 10.9% |
| Standard Deviation (Sample) | 7.3% | 9.1% |
| Standard Deviation (Population) | 7.2% | 9.0% |
Similar Demographics by Currently Married
Demographics Similar to Kiowa by Currently Married
In terms of currently married, the demographic groups most similar to Kiowa are Immigrants from El Salvador (43.1%, a difference of 0.010%), Immigrants from Ecuador (43.2%, a difference of 0.11%), Apache (43.2%, a difference of 0.19%), Chippewa (43.2%, a difference of 0.19%), and Central American Indian (43.3%, a difference of 0.27%).
| Demographics | Rating | Rank | Currently Married |
| Sierra Leoneans | 0.1 /100 | #276 | Tragic 43.4% |
| Immigrants | Nigeria | 0.1 /100 | #277 | Tragic 43.4% |
| Central Americans | 0.0 /100 | #278 | Tragic 43.3% |
| Central American Indians | 0.0 /100 | #279 | Tragic 43.3% |
| Apache | 0.0 /100 | #280 | Tragic 43.2% |
| Chippewa | 0.0 /100 | #281 | Tragic 43.2% |
| Immigrants | Ecuador | 0.0 /100 | #282 | Tragic 43.2% |
| Kiowa | 0.0 /100 | #283 | Tragic 43.2% |
| Immigrants | El Salvador | 0.0 /100 | #284 | Tragic 43.1% |
| Immigrants | Middle Africa | 0.0 /100 | #285 | Tragic 43.0% |
| Ghanaians | 0.0 /100 | #286 | Tragic 42.9% |
| Guatemalans | 0.0 /100 | #287 | Tragic 42.9% |
| Natives/Alaskans | 0.0 /100 | #288 | Tragic 42.8% |
| Paiute | 0.0 /100 | #289 | Tragic 42.7% |
| Immigrants | Ghana | 0.0 /100 | #290 | Tragic 42.7% |
Demographics Similar to Lumbee by Currently Married
In terms of currently married, the demographic groups most similar to Lumbee are Puerto Rican (39.9%, a difference of 0.16%), Yup'ik (39.9%, a difference of 0.18%), British West Indian (39.8%, a difference of 0.18%), Black/African American (39.6%, a difference of 0.56%), and Immigrants from St. Vincent and the Grenadines (40.1%, a difference of 0.57%).
| Demographics | Rating | Rank | Currently Married |
| Arapaho | 0.0 /100 | #328 | Tragic 40.5% |
| Crow | 0.0 /100 | #329 | Tragic 40.4% |
| Immigrants | Dominica | 0.0 /100 | #330 | Tragic 40.3% |
| Immigrants | Barbados | 0.0 /100 | #331 | Tragic 40.3% |
| Immigrants | St. Vincent and the Grenadines | 0.0 /100 | #332 | Tragic 40.1% |
| Yup'ik | 0.0 /100 | #333 | Tragic 39.9% |
| Puerto Ricans | 0.0 /100 | #334 | Tragic 39.9% |
| Lumbee | 0.0 /100 | #335 | Tragic 39.8% |
| British West Indians | 0.0 /100 | #336 | Tragic 39.8% |
| Blacks/African Americans | 0.0 /100 | #337 | Tragic 39.6% |
| Cape Verdeans | 0.0 /100 | #338 | Tragic 39.6% |
| Dominicans | 0.0 /100 | #339 | Tragic 39.5% |
| Immigrants | Grenada | 0.0 /100 | #340 | Tragic 39.1% |
| Navajo | 0.0 /100 | #341 | Tragic 39.0% |
| Immigrants | Dominican Republic | 0.0 /100 | #342 | Tragic 38.9% |