Kiowa vs Immigrants from the Azores Child Poverty Under the Age of 5
COMPARE
Kiowa
Immigrants from the Azores
Child Poverty Under the Age of 5
Child Poverty Under the Age of 5 Comparison
Kiowa
Immigrants from the Azores
24.5%
CHILD POVERTY UNDER THE AGE OF 5
0.0/ 100
METRIC RATING
331st/ 347
METRIC RANK
18.9%
CHILD POVERTY UNDER THE AGE OF 5
2.6/ 100
METRIC RATING
220th/ 347
METRIC RANK
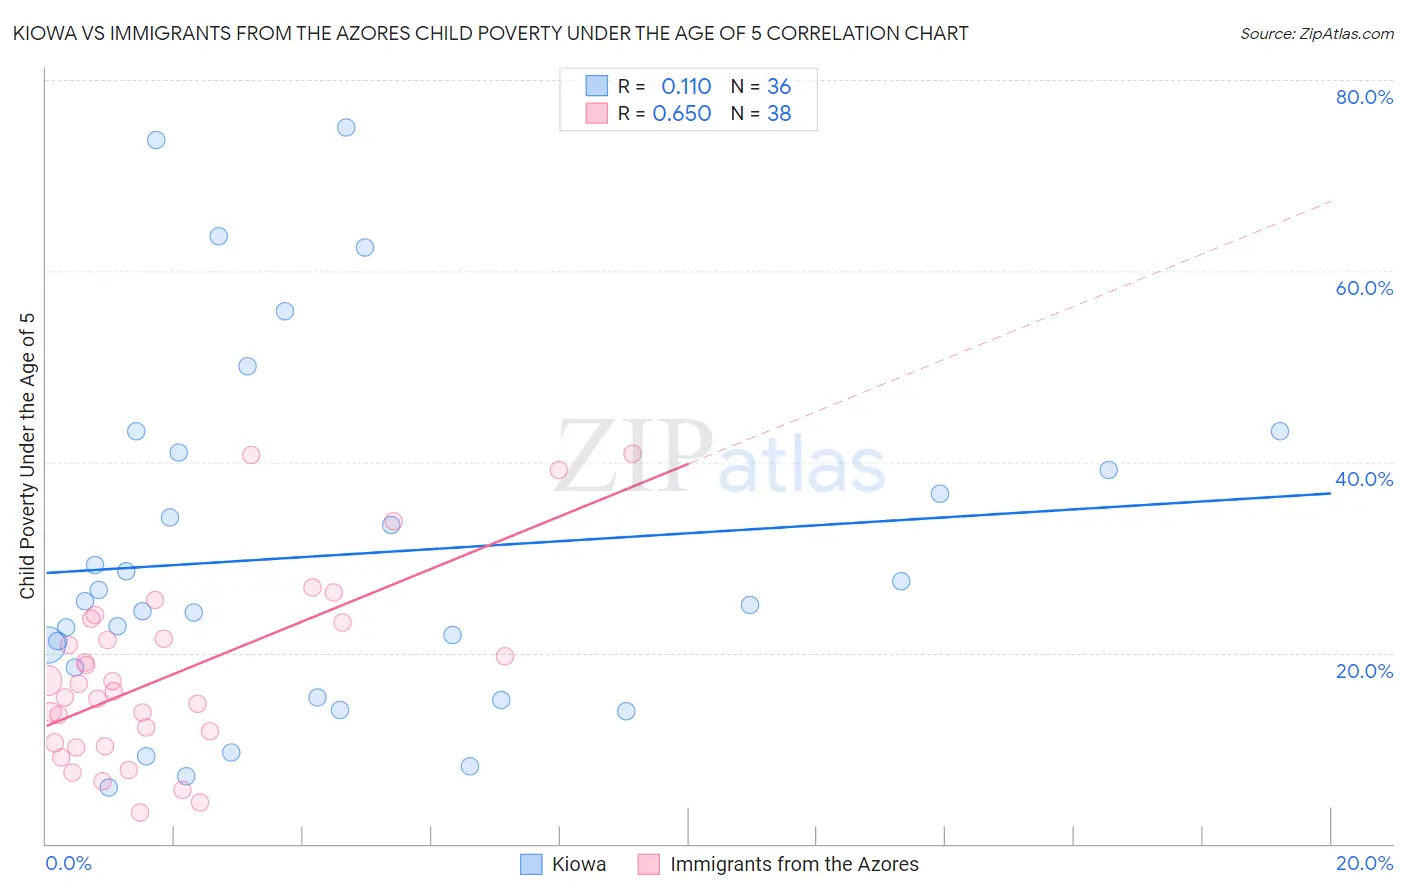
Kiowa vs Immigrants from the Azores Child Poverty Under the Age of 5 Correlation Chart
The statistical analysis conducted on geographies consisting of 55,875,823 people shows a poor positive correlation between the proportion of Kiowa and poverty level among children under the age of 5 in the United States with a correlation coefficient (R) of 0.110 and weighted average of 24.5%. Similarly, the statistical analysis conducted on geographies consisting of 45,317,352 people shows a significant positive correlation between the proportion of Immigrants from the Azores and poverty level among children under the age of 5 in the United States with a correlation coefficient (R) of 0.650 and weighted average of 18.9%, a difference of 29.8%.
Child Poverty Under the Age of 5 Correlation Summary
| Measurement | Kiowa | Immigrants from the Azores |
| Minimum | 5.8% | 3.3% |
| Maximum | 75.0% | 40.8% |
| Range | 69.2% | 37.5% |
| Mean | 30.2% | 17.8% |
| Median | 25.2% | 16.4% |
| Interquartile 25% (IQ1) | 16.9% | 10.6% |
| Interquartile 75% (IQ3) | 40.1% | 23.2% |
| Interquartile Range (IQR) | 23.2% | 12.6% |
| Standard Deviation (Sample) | 18.4% | 9.6% |
| Standard Deviation (Population) | 18.1% | 9.4% |
Similar Demographics by Child Poverty Under the Age of 5
Demographics Similar to Kiowa by Child Poverty Under the Age of 5
In terms of child poverty under the age of 5, the demographic groups most similar to Kiowa are Creek (24.2%, a difference of 1.0%), Cajun (24.1%, a difference of 1.5%), Immigrants from Dominican Republic (24.1%, a difference of 1.7%), Dominican (24.0%, a difference of 1.8%), and Apache (25.0%, a difference of 2.2%).
| Demographics | Rating | Rank | Child Poverty Under the Age of 5 |
| Paiute | 0.0 /100 | #324 | Tragic 23.8% |
| Immigrants | Congo | 0.0 /100 | #325 | Tragic 23.9% |
| Central American Indians | 0.0 /100 | #326 | Tragic 23.9% |
| Dominicans | 0.0 /100 | #327 | Tragic 24.0% |
| Immigrants | Dominican Republic | 0.0 /100 | #328 | Tragic 24.1% |
| Cajuns | 0.0 /100 | #329 | Tragic 24.1% |
| Creek | 0.0 /100 | #330 | Tragic 24.2% |
| Kiowa | 0.0 /100 | #331 | Tragic 24.5% |
| Apache | 0.0 /100 | #332 | Tragic 25.0% |
| Natives/Alaskans | 0.0 /100 | #333 | Tragic 25.6% |
| Blacks/African Americans | 0.0 /100 | #334 | Tragic 25.7% |
| Colville | 0.0 /100 | #335 | Tragic 25.7% |
| Sioux | 0.0 /100 | #336 | Tragic 26.9% |
| Pima | 0.0 /100 | #337 | Tragic 27.4% |
| Hopi | 0.0 /100 | #338 | Tragic 27.7% |
Demographics Similar to Immigrants from the Azores by Child Poverty Under the Age of 5
In terms of child poverty under the age of 5, the demographic groups most similar to Immigrants from the Azores are German Russian (18.8%, a difference of 0.36%), Immigrants from Nigeria (19.0%, a difference of 0.56%), Delaware (18.7%, a difference of 0.67%), Alsatian (19.1%, a difference of 1.1%), and Cuban (19.1%, a difference of 1.1%).
| Demographics | Rating | Rank | Child Poverty Under the Age of 5 |
| Immigrants | Thailand | 8.6 /100 | #213 | Tragic 18.3% |
| Malaysians | 6.5 /100 | #214 | Tragic 18.4% |
| Immigrants | Panama | 6.0 /100 | #215 | Tragic 18.5% |
| Hmong | 5.0 /100 | #216 | Tragic 18.5% |
| Immigrants | Africa | 4.6 /100 | #217 | Tragic 18.6% |
| Delaware | 3.4 /100 | #218 | Tragic 18.7% |
| German Russians | 3.0 /100 | #219 | Tragic 18.8% |
| Immigrants | Azores | 2.6 /100 | #220 | Tragic 18.9% |
| Immigrants | Nigeria | 2.1 /100 | #221 | Tragic 19.0% |
| Alsatians | 1.7 /100 | #222 | Tragic 19.1% |
| Cubans | 1.7 /100 | #223 | Tragic 19.1% |
| Nicaraguans | 1.6 /100 | #224 | Tragic 19.1% |
| Nigerians | 1.6 /100 | #225 | Tragic 19.1% |
| Immigrants | Eritrea | 1.5 /100 | #226 | Tragic 19.1% |
| Cape Verdeans | 1.4 /100 | #227 | Tragic 19.1% |