Kiowa vs Bhutanese Currently Married
COMPARE
Kiowa
Bhutanese
Currently Married
Currently Married Comparison
Kiowa
Bhutanese
43.2%
CURRENTLY MARRIED
0.0/ 100
METRIC RATING
283rd/ 347
METRIC RANK
48.6%
CURRENTLY MARRIED
99.1/ 100
METRIC RATING
49th/ 347
METRIC RANK
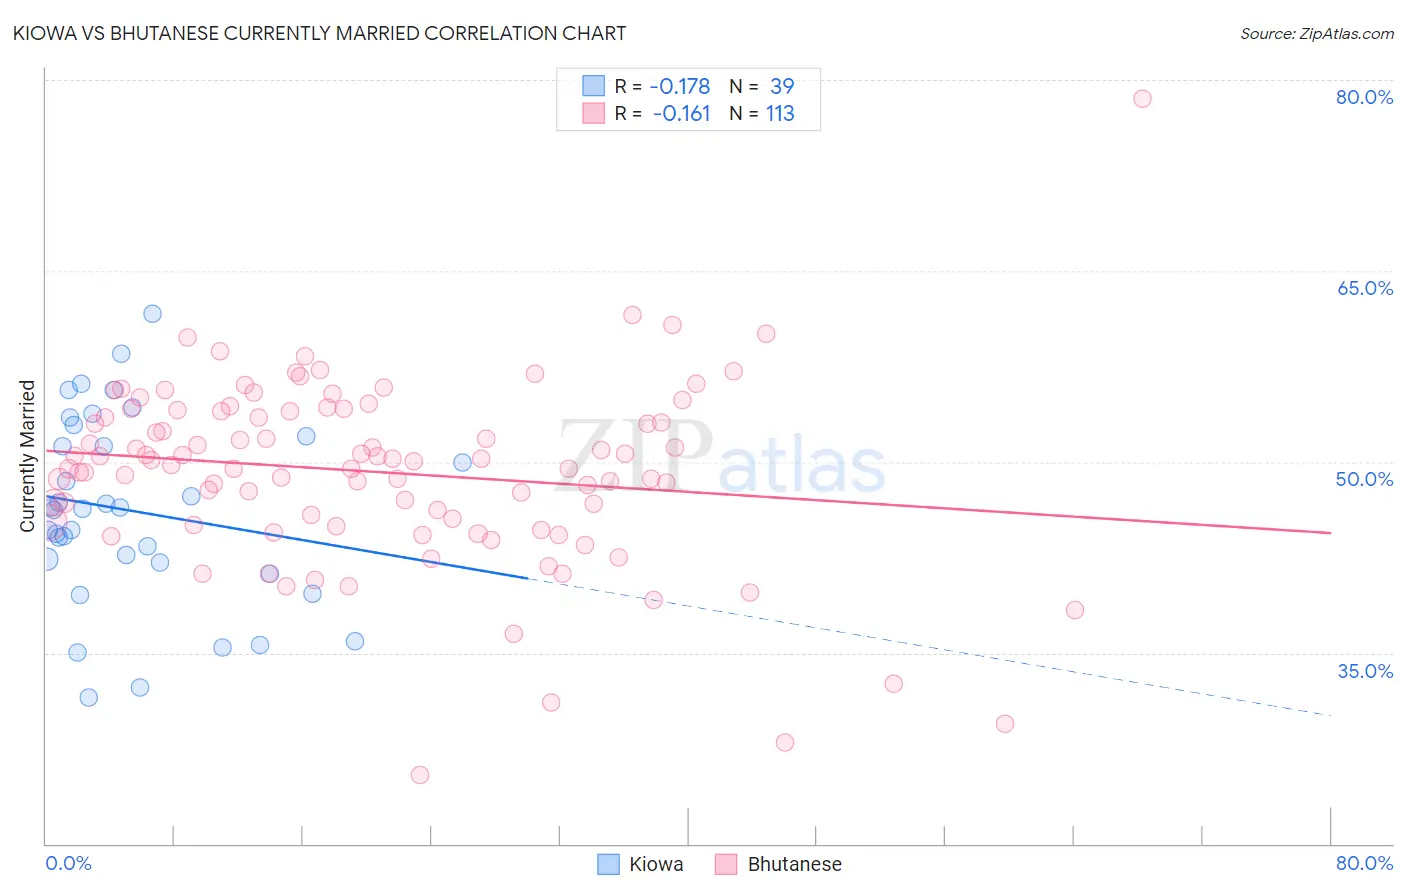
Kiowa vs Bhutanese Currently Married Correlation Chart
The statistical analysis conducted on geographies consisting of 56,101,122 people shows a poor negative correlation between the proportion of Kiowa and percentage of population currently married in the United States with a correlation coefficient (R) of -0.178 and weighted average of 43.2%. Similarly, the statistical analysis conducted on geographies consisting of 455,493,629 people shows a poor negative correlation between the proportion of Bhutanese and percentage of population currently married in the United States with a correlation coefficient (R) of -0.161 and weighted average of 48.6%, a difference of 12.7%.
Currently Married Correlation Summary
| Measurement | Kiowa | Bhutanese |
| Minimum | 31.5% | 25.4% |
| Maximum | 61.6% | 78.5% |
| Range | 30.1% | 53.1% |
| Mean | 46.1% | 49.2% |
| Median | 46.3% | 50.1% |
| Interquartile 25% (IQ1) | 42.1% | 45.2% |
| Interquartile 75% (IQ3) | 52.0% | 54.0% |
| Interquartile Range (IQR) | 9.9% | 8.9% |
| Standard Deviation (Sample) | 7.3% | 7.3% |
| Standard Deviation (Population) | 7.2% | 7.3% |
Similar Demographics by Currently Married
Demographics Similar to Kiowa by Currently Married
In terms of currently married, the demographic groups most similar to Kiowa are Immigrants from El Salvador (43.1%, a difference of 0.010%), Immigrants from Ecuador (43.2%, a difference of 0.11%), Apache (43.2%, a difference of 0.19%), Chippewa (43.2%, a difference of 0.19%), and Central American Indian (43.3%, a difference of 0.27%).
| Demographics | Rating | Rank | Currently Married |
| Sierra Leoneans | 0.1 /100 | #276 | Tragic 43.4% |
| Immigrants | Nigeria | 0.1 /100 | #277 | Tragic 43.4% |
| Central Americans | 0.0 /100 | #278 | Tragic 43.3% |
| Central American Indians | 0.0 /100 | #279 | Tragic 43.3% |
| Apache | 0.0 /100 | #280 | Tragic 43.2% |
| Chippewa | 0.0 /100 | #281 | Tragic 43.2% |
| Immigrants | Ecuador | 0.0 /100 | #282 | Tragic 43.2% |
| Kiowa | 0.0 /100 | #283 | Tragic 43.2% |
| Immigrants | El Salvador | 0.0 /100 | #284 | Tragic 43.1% |
| Immigrants | Middle Africa | 0.0 /100 | #285 | Tragic 43.0% |
| Ghanaians | 0.0 /100 | #286 | Tragic 42.9% |
| Guatemalans | 0.0 /100 | #287 | Tragic 42.9% |
| Natives/Alaskans | 0.0 /100 | #288 | Tragic 42.8% |
| Paiute | 0.0 /100 | #289 | Tragic 42.7% |
| Immigrants | Ghana | 0.0 /100 | #290 | Tragic 42.7% |
Demographics Similar to Bhutanese by Currently Married
In terms of currently married, the demographic groups most similar to Bhutanese are Iranian (48.6%, a difference of 0.060%), White/Caucasian (48.6%, a difference of 0.070%), Austrian (48.7%, a difference of 0.13%), Northern European (48.7%, a difference of 0.14%), and Immigrants from Iran (48.7%, a difference of 0.15%).
| Demographics | Rating | Rank | Currently Married |
| Finns | 99.3 /100 | #42 | Exceptional 48.8% |
| Scotch-Irish | 99.3 /100 | #43 | Exceptional 48.7% |
| Immigrants | North America | 99.3 /100 | #44 | Exceptional 48.7% |
| Belgians | 99.3 /100 | #45 | Exceptional 48.7% |
| Immigrants | Iran | 99.2 /100 | #46 | Exceptional 48.7% |
| Northern Europeans | 99.2 /100 | #47 | Exceptional 48.7% |
| Austrians | 99.2 /100 | #48 | Exceptional 48.7% |
| Bhutanese | 99.1 /100 | #49 | Exceptional 48.6% |
| Iranians | 99.0 /100 | #50 | Exceptional 48.6% |
| Whites/Caucasians | 99.0 /100 | #51 | Exceptional 48.6% |
| Russians | 98.9 /100 | #52 | Exceptional 48.6% |
| Immigrants | Austria | 98.8 /100 | #53 | Exceptional 48.5% |
| Immigrants | Moldova | 98.7 /100 | #54 | Exceptional 48.5% |
| Immigrants | North Macedonia | 98.7 /100 | #55 | Exceptional 48.5% |
| Latvians | 98.7 /100 | #56 | Exceptional 48.5% |