Kiowa vs Immigrants from the Azores 2nd Grade
COMPARE
Kiowa
Immigrants from the Azores
2nd Grade
2nd Grade Comparison
Kiowa
Immigrants from the Azores
98.3%
2ND GRADE
99.8/ 100
METRIC RATING
54th/ 347
METRIC RANK
96.8%
2ND GRADE
0.0/ 100
METRIC RATING
307th/ 347
METRIC RANK
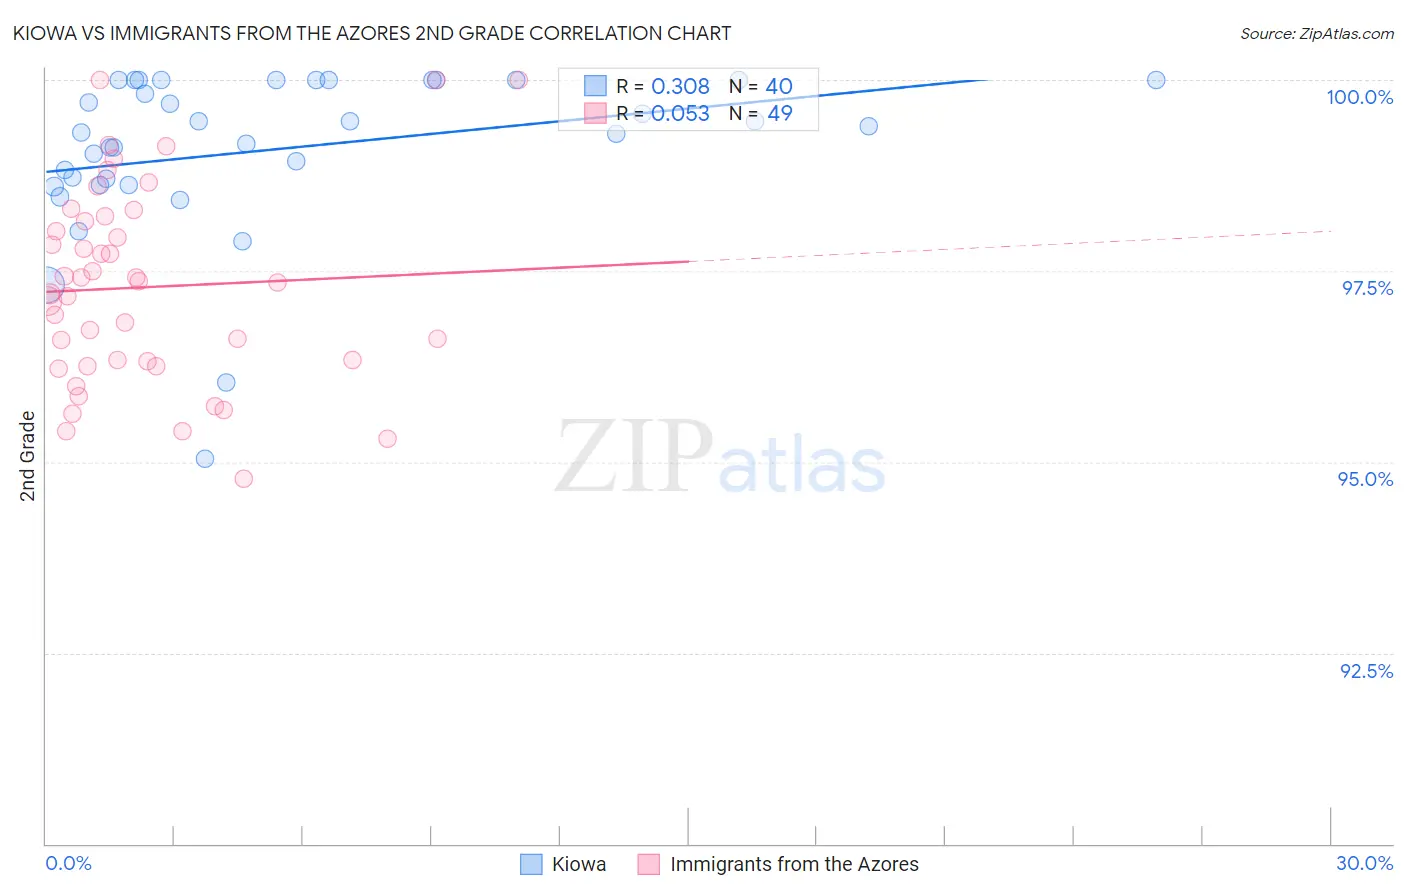
Kiowa vs Immigrants from the Azores 2nd Grade Correlation Chart
The statistical analysis conducted on geographies consisting of 56,100,633 people shows a mild positive correlation between the proportion of Kiowa and percentage of population with at least 2nd grade education in the United States with a correlation coefficient (R) of 0.308 and weighted average of 98.3%. Similarly, the statistical analysis conducted on geographies consisting of 46,257,310 people shows a slight positive correlation between the proportion of Immigrants from the Azores and percentage of population with at least 2nd grade education in the United States with a correlation coefficient (R) of 0.053 and weighted average of 96.8%, a difference of 1.5%.
2nd Grade Correlation Summary
| Measurement | Kiowa | Immigrants from the Azores |
| Minimum | 95.0% | 94.8% |
| Maximum | 100.0% | 100.0% |
| Range | 5.0% | 5.2% |
| Mean | 99.1% | 97.3% |
| Median | 99.4% | 97.3% |
| Interquartile 25% (IQ1) | 98.7% | 96.3% |
| Interquartile 75% (IQ3) | 100.0% | 98.2% |
| Interquartile Range (IQR) | 1.3% | 1.9% |
| Standard Deviation (Sample) | 1.1% | 1.3% |
| Standard Deviation (Population) | 1.1% | 1.3% |
Similar Demographics by 2nd Grade
Demographics Similar to Kiowa by 2nd Grade
In terms of 2nd grade, the demographic groups most similar to Kiowa are Pueblo (98.3%, a difference of 0.0%), Immigrants from Scotland (98.3%, a difference of 0.0%), Celtic (98.4%, a difference of 0.010%), White/Caucasian (98.4%, a difference of 0.010%), and Estonian (98.4%, a difference of 0.010%).
| Demographics | Rating | Rank | 2nd Grade |
| Ottawa | 99.9 /100 | #47 | Exceptional 98.4% |
| Czechoslovakians | 99.9 /100 | #48 | Exceptional 98.4% |
| Celtics | 99.8 /100 | #49 | Exceptional 98.4% |
| Whites/Caucasians | 99.8 /100 | #50 | Exceptional 98.4% |
| Estonians | 99.8 /100 | #51 | Exceptional 98.4% |
| Australians | 99.8 /100 | #52 | Exceptional 98.4% |
| Pueblo | 99.8 /100 | #53 | Exceptional 98.3% |
| Kiowa | 99.8 /100 | #54 | Exceptional 98.3% |
| Immigrants | Scotland | 99.8 /100 | #55 | Exceptional 98.3% |
| Americans | 99.8 /100 | #56 | Exceptional 98.3% |
| Austrians | 99.8 /100 | #57 | Exceptional 98.3% |
| Bulgarians | 99.8 /100 | #58 | Exceptional 98.3% |
| Slavs | 99.8 /100 | #59 | Exceptional 98.3% |
| Creek | 99.8 /100 | #60 | Exceptional 98.3% |
| Immigrants | Canada | 99.8 /100 | #61 | Exceptional 98.3% |
Demographics Similar to Immigrants from the Azores by 2nd Grade
In terms of 2nd grade, the demographic groups most similar to Immigrants from the Azores are Immigrants from Haiti (96.8%, a difference of 0.010%), Belizean (96.8%, a difference of 0.010%), Sri Lankan (96.8%, a difference of 0.020%), Guyanese (96.8%, a difference of 0.020%), and Immigrants from Somalia (96.9%, a difference of 0.030%).
| Demographics | Rating | Rank | 2nd Grade |
| Immigrants | South Eastern Asia | 0.0 /100 | #300 | Tragic 97.0% |
| Central American Indians | 0.0 /100 | #301 | Tragic 97.0% |
| Somalis | 0.0 /100 | #302 | Tragic 97.0% |
| Ecuadorians | 0.0 /100 | #303 | Tragic 96.9% |
| Immigrants | Caribbean | 0.0 /100 | #304 | Tragic 96.9% |
| Nicaraguans | 0.0 /100 | #305 | Tragic 96.9% |
| Immigrants | Somalia | 0.0 /100 | #306 | Tragic 96.9% |
| Immigrants | Azores | 0.0 /100 | #307 | Tragic 96.8% |
| Immigrants | Haiti | 0.0 /100 | #308 | Tragic 96.8% |
| Belizeans | 0.0 /100 | #309 | Tragic 96.8% |
| Sri Lankans | 0.0 /100 | #310 | Tragic 96.8% |
| Guyanese | 0.0 /100 | #311 | Tragic 96.8% |
| Cape Verdeans | 0.0 /100 | #312 | Tragic 96.8% |
| Hispanics or Latinos | 0.0 /100 | #313 | Tragic 96.8% |
| Immigrants | Ecuador | 0.0 /100 | #314 | Tragic 96.8% |