Kiowa vs Immigrants from Scotland Currently Married
COMPARE
Kiowa
Immigrants from Scotland
Currently Married
Currently Married Comparison
Kiowa
Immigrants from Scotland
43.2%
CURRENTLY MARRIED
0.0/ 100
METRIC RATING
283rd/ 347
METRIC RANK
49.3%
CURRENTLY MARRIED
99.8/ 100
METRIC RATING
18th/ 347
METRIC RANK
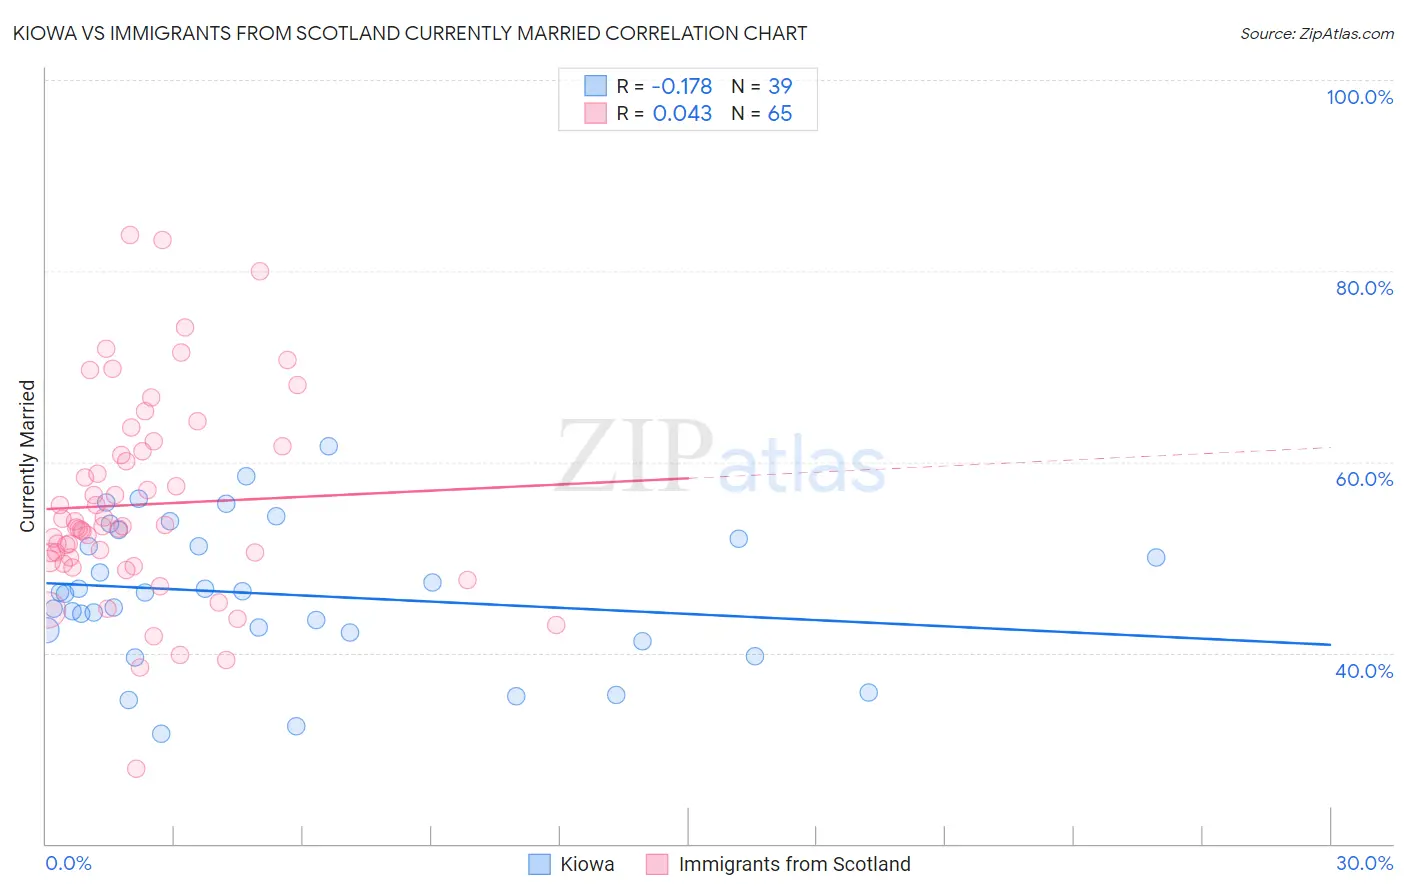
Kiowa vs Immigrants from Scotland Currently Married Correlation Chart
The statistical analysis conducted on geographies consisting of 56,101,122 people shows a poor negative correlation between the proportion of Kiowa and percentage of population currently married in the United States with a correlation coefficient (R) of -0.178 and weighted average of 43.2%. Similarly, the statistical analysis conducted on geographies consisting of 196,396,392 people shows no correlation between the proportion of Immigrants from Scotland and percentage of population currently married in the United States with a correlation coefficient (R) of 0.043 and weighted average of 49.3%, a difference of 14.4%.
Currently Married Correlation Summary
| Measurement | Kiowa | Immigrants from Scotland |
| Minimum | 31.5% | 27.9% |
| Maximum | 61.6% | 83.8% |
| Range | 30.1% | 55.9% |
| Mean | 46.1% | 55.5% |
| Median | 46.3% | 53.2% |
| Interquartile 25% (IQ1) | 42.1% | 49.5% |
| Interquartile 75% (IQ3) | 52.0% | 61.4% |
| Interquartile Range (IQR) | 9.9% | 11.9% |
| Standard Deviation (Sample) | 7.3% | 10.7% |
| Standard Deviation (Population) | 7.2% | 10.7% |
Similar Demographics by Currently Married
Demographics Similar to Kiowa by Currently Married
In terms of currently married, the demographic groups most similar to Kiowa are Immigrants from El Salvador (43.1%, a difference of 0.010%), Immigrants from Ecuador (43.2%, a difference of 0.11%), Apache (43.2%, a difference of 0.19%), Chippewa (43.2%, a difference of 0.19%), and Central American Indian (43.3%, a difference of 0.27%).
| Demographics | Rating | Rank | Currently Married |
| Sierra Leoneans | 0.1 /100 | #276 | Tragic 43.4% |
| Immigrants | Nigeria | 0.1 /100 | #277 | Tragic 43.4% |
| Central Americans | 0.0 /100 | #278 | Tragic 43.3% |
| Central American Indians | 0.0 /100 | #279 | Tragic 43.3% |
| Apache | 0.0 /100 | #280 | Tragic 43.2% |
| Chippewa | 0.0 /100 | #281 | Tragic 43.2% |
| Immigrants | Ecuador | 0.0 /100 | #282 | Tragic 43.2% |
| Kiowa | 0.0 /100 | #283 | Tragic 43.2% |
| Immigrants | El Salvador | 0.0 /100 | #284 | Tragic 43.1% |
| Immigrants | Middle Africa | 0.0 /100 | #285 | Tragic 43.0% |
| Ghanaians | 0.0 /100 | #286 | Tragic 42.9% |
| Guatemalans | 0.0 /100 | #287 | Tragic 42.9% |
| Natives/Alaskans | 0.0 /100 | #288 | Tragic 42.8% |
| Paiute | 0.0 /100 | #289 | Tragic 42.7% |
| Immigrants | Ghana | 0.0 /100 | #290 | Tragic 42.7% |
Demographics Similar to Immigrants from Scotland by Currently Married
In terms of currently married, the demographic groups most similar to Immigrants from Scotland are European (49.3%, a difference of 0.020%), Luxembourger (49.3%, a difference of 0.15%), Scottish (49.2%, a difference of 0.26%), Scandinavian (49.5%, a difference of 0.29%), and Chinese (49.5%, a difference of 0.31%).
| Demographics | Rating | Rank | Currently Married |
| English | 99.9 /100 | #11 | Exceptional 49.7% |
| Swiss | 99.9 /100 | #12 | Exceptional 49.7% |
| Dutch | 99.9 /100 | #13 | Exceptional 49.6% |
| Germans | 99.9 /100 | #14 | Exceptional 49.6% |
| Pennsylvania Germans | 99.9 /100 | #15 | Exceptional 49.6% |
| Chinese | 99.9 /100 | #16 | Exceptional 49.5% |
| Scandinavians | 99.9 /100 | #17 | Exceptional 49.5% |
| Immigrants | Scotland | 99.8 /100 | #18 | Exceptional 49.3% |
| Europeans | 99.8 /100 | #19 | Exceptional 49.3% |
| Luxembourgers | 99.8 /100 | #20 | Exceptional 49.3% |
| Scottish | 99.8 /100 | #21 | Exceptional 49.2% |
| Bulgarians | 99.7 /100 | #22 | Exceptional 49.1% |
| Immigrants | Pakistan | 99.7 /100 | #23 | Exceptional 49.1% |
| Lithuanians | 99.6 /100 | #24 | Exceptional 49.0% |
| Maltese | 99.6 /100 | #25 | Exceptional 49.0% |