Kiowa vs Immigrants from Bahamas Currently Married
COMPARE
Kiowa
Immigrants from Bahamas
Currently Married
Currently Married Comparison
Kiowa
Immigrants from Bahamas
43.2%
CURRENTLY MARRIED
0.0/ 100
METRIC RATING
283rd/ 347
METRIC RANK
41.9%
CURRENTLY MARRIED
0.0/ 100
METRIC RATING
304th/ 347
METRIC RANK
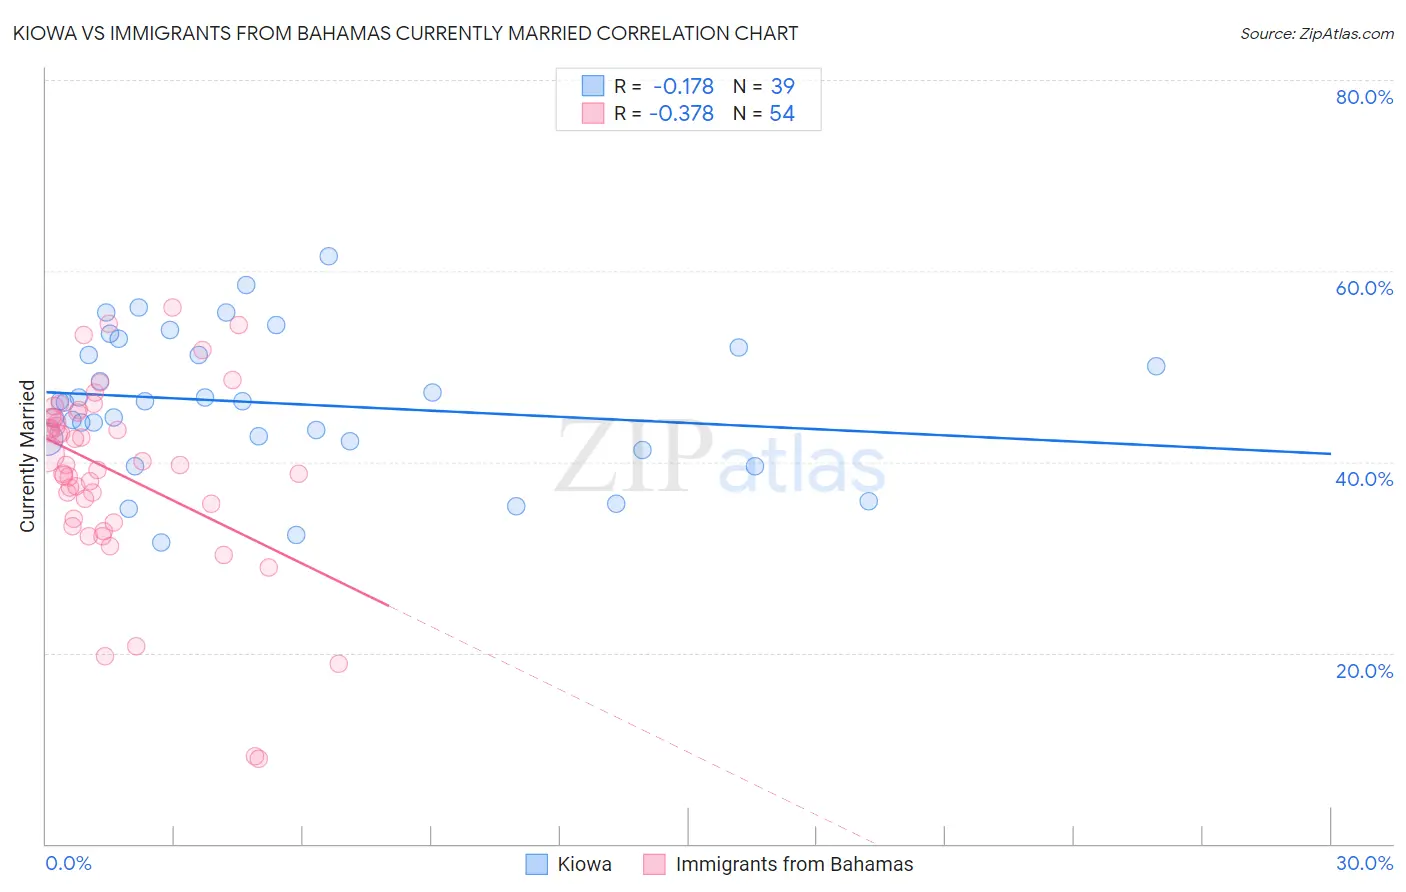
Kiowa vs Immigrants from Bahamas Currently Married Correlation Chart
The statistical analysis conducted on geographies consisting of 56,101,122 people shows a poor negative correlation between the proportion of Kiowa and percentage of population currently married in the United States with a correlation coefficient (R) of -0.178 and weighted average of 43.2%. Similarly, the statistical analysis conducted on geographies consisting of 104,648,272 people shows a mild negative correlation between the proportion of Immigrants from Bahamas and percentage of population currently married in the United States with a correlation coefficient (R) of -0.378 and weighted average of 41.9%, a difference of 3.0%.
Currently Married Correlation Summary
| Measurement | Kiowa | Immigrants from Bahamas |
| Minimum | 31.5% | 8.9% |
| Maximum | 61.6% | 56.2% |
| Range | 30.1% | 47.3% |
| Mean | 46.1% | 38.9% |
| Median | 46.3% | 39.7% |
| Interquartile 25% (IQ1) | 42.1% | 34.0% |
| Interquartile 75% (IQ3) | 52.0% | 44.7% |
| Interquartile Range (IQR) | 9.9% | 10.6% |
| Standard Deviation (Sample) | 7.3% | 9.9% |
| Standard Deviation (Population) | 7.2% | 9.8% |
Similar Demographics by Currently Married
Demographics Similar to Kiowa by Currently Married
In terms of currently married, the demographic groups most similar to Kiowa are Immigrants from El Salvador (43.1%, a difference of 0.010%), Immigrants from Ecuador (43.2%, a difference of 0.11%), Apache (43.2%, a difference of 0.19%), Chippewa (43.2%, a difference of 0.19%), and Central American Indian (43.3%, a difference of 0.27%).
| Demographics | Rating | Rank | Currently Married |
| Sierra Leoneans | 0.1 /100 | #276 | Tragic 43.4% |
| Immigrants | Nigeria | 0.1 /100 | #277 | Tragic 43.4% |
| Central Americans | 0.0 /100 | #278 | Tragic 43.3% |
| Central American Indians | 0.0 /100 | #279 | Tragic 43.3% |
| Apache | 0.0 /100 | #280 | Tragic 43.2% |
| Chippewa | 0.0 /100 | #281 | Tragic 43.2% |
| Immigrants | Ecuador | 0.0 /100 | #282 | Tragic 43.2% |
| Kiowa | 0.0 /100 | #283 | Tragic 43.2% |
| Immigrants | El Salvador | 0.0 /100 | #284 | Tragic 43.1% |
| Immigrants | Middle Africa | 0.0 /100 | #285 | Tragic 43.0% |
| Ghanaians | 0.0 /100 | #286 | Tragic 42.9% |
| Guatemalans | 0.0 /100 | #287 | Tragic 42.9% |
| Natives/Alaskans | 0.0 /100 | #288 | Tragic 42.8% |
| Paiute | 0.0 /100 | #289 | Tragic 42.7% |
| Immigrants | Ghana | 0.0 /100 | #290 | Tragic 42.7% |
Demographics Similar to Immigrants from Bahamas by Currently Married
In terms of currently married, the demographic groups most similar to Immigrants from Bahamas are Immigrants from Trinidad and Tobago (41.9%, a difference of 0.030%), Immigrants from Guyana (41.9%, a difference of 0.040%), Sioux (41.9%, a difference of 0.11%), Immigrants from Zaire (42.0%, a difference of 0.13%), and African (41.8%, a difference of 0.18%).
| Demographics | Rating | Rank | Currently Married |
| Cheyenne | 0.0 /100 | #297 | Tragic 42.2% |
| Immigrants | Honduras | 0.0 /100 | #298 | Tragic 42.2% |
| Liberians | 0.0 /100 | #299 | Tragic 42.2% |
| Belizeans | 0.0 /100 | #300 | Tragic 42.2% |
| Immigrants | Yemen | 0.0 /100 | #301 | Tragic 42.1% |
| Immigrants | Zaire | 0.0 /100 | #302 | Tragic 42.0% |
| Sioux | 0.0 /100 | #303 | Tragic 41.9% |
| Immigrants | Bahamas | 0.0 /100 | #304 | Tragic 41.9% |
| Immigrants | Trinidad and Tobago | 0.0 /100 | #305 | Tragic 41.9% |
| Immigrants | Guyana | 0.0 /100 | #306 | Tragic 41.9% |
| Africans | 0.0 /100 | #307 | Tragic 41.8% |
| Immigrants | Belize | 0.0 /100 | #308 | Tragic 41.8% |
| Immigrants | Liberia | 0.0 /100 | #309 | Tragic 41.8% |
| Guyanese | 0.0 /100 | #310 | Tragic 41.6% |
| Trinidadians and Tobagonians | 0.0 /100 | #311 | Tragic 41.5% |