Italian vs German Russian Births to Unmarried Women
COMPARE
Italian
German Russian
Births to Unmarried Women
Births to Unmarried Women Comparison
Italians
German Russians
30.8%
BIRTHS TO UNMARRIED WOMEN
77.0/ 100
METRIC RATING
151st/ 347
METRIC RANK
33.1%
BIRTHS TO UNMARRIED WOMEN
13.1/ 100
METRIC RATING
205th/ 347
METRIC RANK
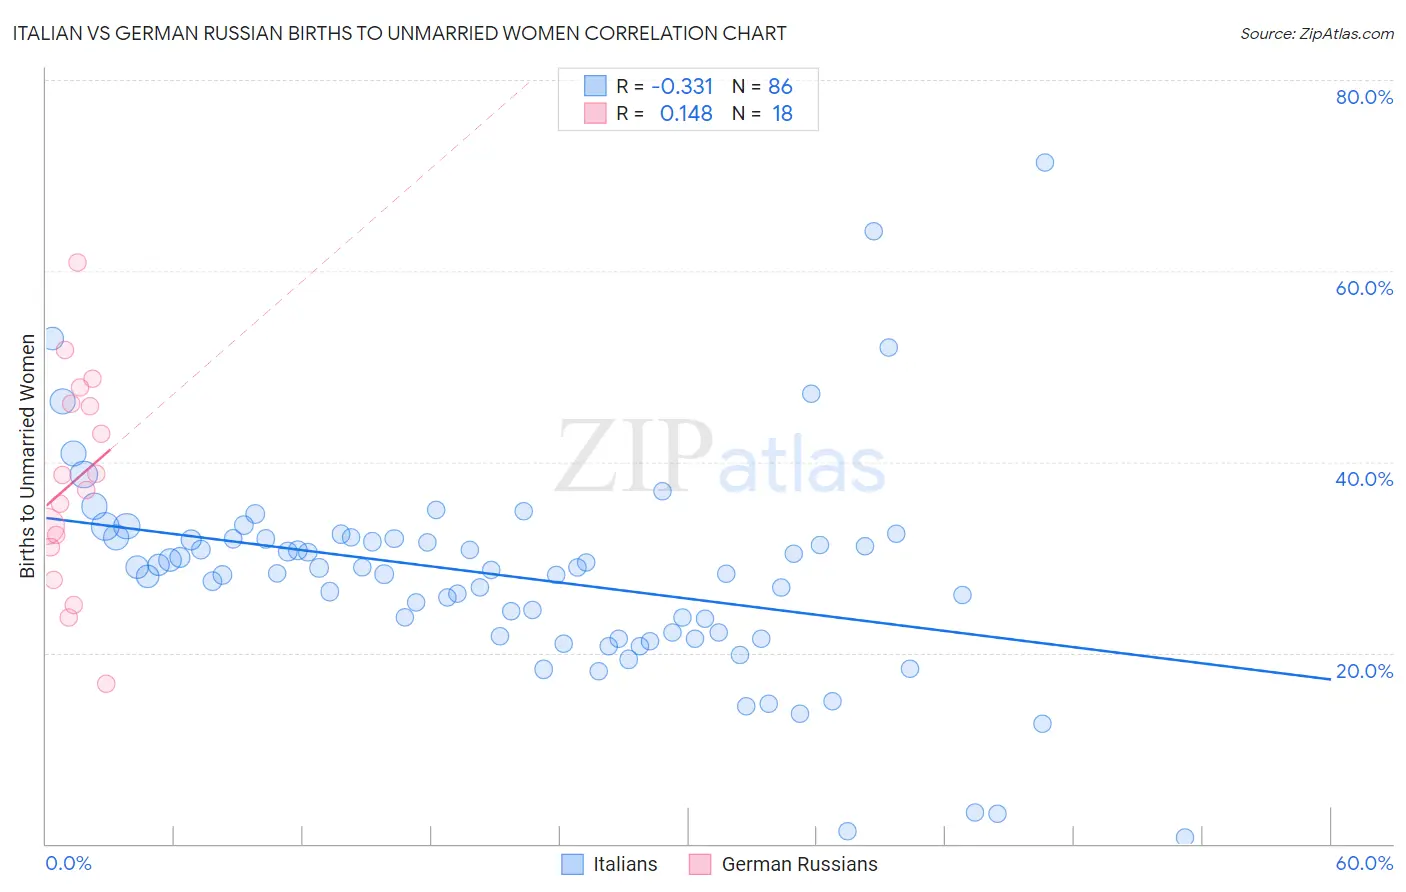
Italian vs German Russian Births to Unmarried Women Correlation Chart
The statistical analysis conducted on geographies consisting of 508,502,070 people shows a mild negative correlation between the proportion of Italians and percentage of births to unmarried women in the United States with a correlation coefficient (R) of -0.331 and weighted average of 30.8%. Similarly, the statistical analysis conducted on geographies consisting of 94,648,089 people shows a poor positive correlation between the proportion of German Russians and percentage of births to unmarried women in the United States with a correlation coefficient (R) of 0.148 and weighted average of 33.1%, a difference of 7.5%.
Births to Unmarried Women Correlation Summary
| Measurement | Italian | German Russian |
| Minimum | 0.60% | 16.7% |
| Maximum | 71.4% | 60.9% |
| Range | 70.8% | 44.2% |
| Mean | 28.0% | 38.0% |
| Median | 28.5% | 37.8% |
| Interquartile 25% (IQ1) | 21.7% | 31.1% |
| Interquartile 75% (IQ3) | 31.9% | 46.1% |
| Interquartile Range (IQR) | 10.2% | 15.1% |
| Standard Deviation (Sample) | 11.2% | 11.2% |
| Standard Deviation (Population) | 11.1% | 10.8% |
Similar Demographics by Births to Unmarried Women
Demographics Similar to Italians by Births to Unmarried Women
In terms of births to unmarried women, the demographic groups most similar to Italians are Somali (30.7%, a difference of 0.11%), Polish (30.8%, a difference of 0.11%), British (30.8%, a difference of 0.13%), Yugoslavian (30.8%, a difference of 0.25%), and Serbian (30.7%, a difference of 0.26%).
| Demographics | Rating | Rank | Births to Unmarried Women |
| Czechs | 82.1 /100 | #144 | Excellent 30.5% |
| Immigrants | North America | 81.5 /100 | #145 | Excellent 30.6% |
| Northern Europeans | 81.4 /100 | #146 | Excellent 30.6% |
| Immigrants | Oceania | 81.2 /100 | #147 | Excellent 30.6% |
| Chileans | 79.1 /100 | #148 | Good 30.7% |
| Serbians | 78.8 /100 | #149 | Good 30.7% |
| Somalis | 77.8 /100 | #150 | Good 30.7% |
| Italians | 77.0 /100 | #151 | Good 30.8% |
| Poles | 76.2 /100 | #152 | Good 30.8% |
| British | 76.0 /100 | #153 | Good 30.8% |
| Yugoslavians | 75.1 /100 | #154 | Good 30.8% |
| Immigrants | Bangladesh | 73.9 /100 | #155 | Good 30.9% |
| Carpatho Rusyns | 73.5 /100 | #156 | Good 30.9% |
| Immigrants | Eastern Africa | 72.1 /100 | #157 | Good 31.0% |
| Austrians | 69.9 /100 | #158 | Good 31.0% |
Demographics Similar to German Russians by Births to Unmarried Women
In terms of births to unmarried women, the demographic groups most similar to German Russians are Uruguayan (33.1%, a difference of 0.060%), Immigrants from Africa (33.0%, a difference of 0.23%), Ute (33.0%, a difference of 0.25%), Immigrants from Sudan (33.2%, a difference of 0.34%), and Hawaiian (33.2%, a difference of 0.38%).
| Demographics | Rating | Rank | Births to Unmarried Women |
| Costa Ricans | 20.3 /100 | #198 | Fair 32.7% |
| Immigrants | Thailand | 18.9 /100 | #199 | Poor 32.8% |
| Immigrants | Germany | 18.8 /100 | #200 | Poor 32.8% |
| Immigrants | Burma/Myanmar | 16.7 /100 | #201 | Poor 32.9% |
| Immigrants | Micronesia | 16.6 /100 | #202 | Poor 32.9% |
| Ute | 14.4 /100 | #203 | Poor 33.0% |
| Immigrants | Africa | 14.3 /100 | #204 | Poor 33.0% |
| German Russians | 13.1 /100 | #205 | Poor 33.1% |
| Uruguayans | 12.8 /100 | #206 | Poor 33.1% |
| Immigrants | Sudan | 11.5 /100 | #207 | Poor 33.2% |
| Hawaiians | 11.3 /100 | #208 | Poor 33.2% |
| Whites/Caucasians | 10.7 /100 | #209 | Poor 33.3% |
| Scotch-Irish | 10.7 /100 | #210 | Poor 33.3% |
| Ecuadorians | 10.5 /100 | #211 | Poor 33.3% |
| Celtics | 10.2 /100 | #212 | Poor 33.3% |