Immigrants from Guyana vs German Russian Births to Unmarried Women
COMPARE
Immigrants from Guyana
German Russian
Births to Unmarried Women
Births to Unmarried Women Comparison
Immigrants from Guyana
German Russians
35.0%
BIRTHS TO UNMARRIED WOMEN
1.2/ 100
METRIC RATING
241st/ 347
METRIC RANK
33.1%
BIRTHS TO UNMARRIED WOMEN
13.1/ 100
METRIC RATING
205th/ 347
METRIC RANK
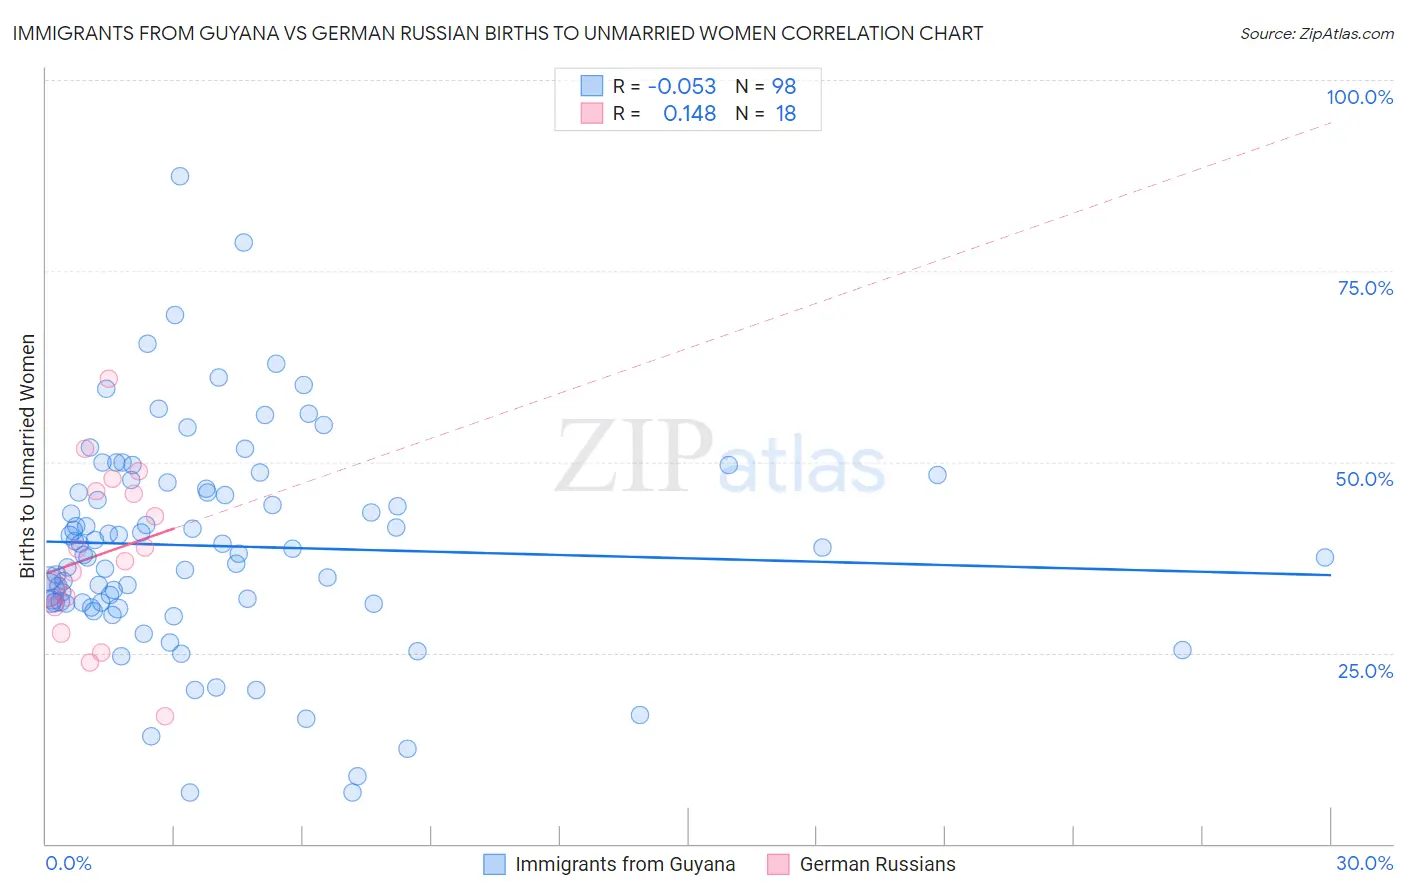
Immigrants from Guyana vs German Russian Births to Unmarried Women Correlation Chart
The statistical analysis conducted on geographies consisting of 177,005,491 people shows a slight negative correlation between the proportion of Immigrants from Guyana and percentage of births to unmarried women in the United States with a correlation coefficient (R) of -0.053 and weighted average of 35.0%. Similarly, the statistical analysis conducted on geographies consisting of 94,648,089 people shows a poor positive correlation between the proportion of German Russians and percentage of births to unmarried women in the United States with a correlation coefficient (R) of 0.148 and weighted average of 33.1%, a difference of 5.6%.
Births to Unmarried Women Correlation Summary
| Measurement | Immigrants from Guyana | German Russian |
| Minimum | 6.7% | 16.7% |
| Maximum | 87.4% | 60.9% |
| Range | 80.7% | 44.2% |
| Mean | 39.0% | 38.0% |
| Median | 38.4% | 37.8% |
| Interquartile 25% (IQ1) | 31.6% | 31.1% |
| Interquartile 75% (IQ3) | 46.5% | 46.1% |
| Interquartile Range (IQR) | 14.9% | 15.1% |
| Standard Deviation (Sample) | 14.0% | 11.2% |
| Standard Deviation (Population) | 14.0% | 10.8% |
Similar Demographics by Births to Unmarried Women
Demographics Similar to Immigrants from Guyana by Births to Unmarried Women
In terms of births to unmarried women, the demographic groups most similar to Immigrants from Guyana are Immigrants from Middle Africa (34.9%, a difference of 0.030%), Indonesian (35.0%, a difference of 0.10%), Sierra Leonean (34.9%, a difference of 0.28%), Immigrants from Cambodia (34.8%, a difference of 0.51%), and Marshallese (34.8%, a difference of 0.57%).
| Demographics | Rating | Rank | Births to Unmarried Women |
| Immigrants | Zaire | 2.3 /100 | #234 | Tragic 34.5% |
| Immigrants | Ghana | 2.2 /100 | #235 | Tragic 34.5% |
| Immigrants | Cameroon | 1.6 /100 | #236 | Tragic 34.7% |
| Marshallese | 1.6 /100 | #237 | Tragic 34.8% |
| Immigrants | Cambodia | 1.6 /100 | #238 | Tragic 34.8% |
| Sierra Leoneans | 1.4 /100 | #239 | Tragic 34.9% |
| Immigrants | Middle Africa | 1.2 /100 | #240 | Tragic 34.9% |
| Immigrants | Guyana | 1.2 /100 | #241 | Tragic 35.0% |
| Indonesians | 1.2 /100 | #242 | Tragic 35.0% |
| Japanese | 0.9 /100 | #243 | Tragic 35.2% |
| Guyanese | 0.9 /100 | #244 | Tragic 35.2% |
| Shoshone | 0.8 /100 | #245 | Tragic 35.3% |
| Nigerians | 0.7 /100 | #246 | Tragic 35.3% |
| Immigrants | Nigeria | 0.7 /100 | #247 | Tragic 35.4% |
| Immigrants | Nonimmigrants | 0.6 /100 | #248 | Tragic 35.5% |
Demographics Similar to German Russians by Births to Unmarried Women
In terms of births to unmarried women, the demographic groups most similar to German Russians are Uruguayan (33.1%, a difference of 0.060%), Immigrants from Africa (33.0%, a difference of 0.23%), Ute (33.0%, a difference of 0.25%), Immigrants from Sudan (33.2%, a difference of 0.34%), and Hawaiian (33.2%, a difference of 0.38%).
| Demographics | Rating | Rank | Births to Unmarried Women |
| Costa Ricans | 20.3 /100 | #198 | Fair 32.7% |
| Immigrants | Thailand | 18.9 /100 | #199 | Poor 32.8% |
| Immigrants | Germany | 18.8 /100 | #200 | Poor 32.8% |
| Immigrants | Burma/Myanmar | 16.7 /100 | #201 | Poor 32.9% |
| Immigrants | Micronesia | 16.6 /100 | #202 | Poor 32.9% |
| Ute | 14.4 /100 | #203 | Poor 33.0% |
| Immigrants | Africa | 14.3 /100 | #204 | Poor 33.0% |
| German Russians | 13.1 /100 | #205 | Poor 33.1% |
| Uruguayans | 12.8 /100 | #206 | Poor 33.1% |
| Immigrants | Sudan | 11.5 /100 | #207 | Poor 33.2% |
| Hawaiians | 11.3 /100 | #208 | Poor 33.2% |
| Whites/Caucasians | 10.7 /100 | #209 | Poor 33.3% |
| Scotch-Irish | 10.7 /100 | #210 | Poor 33.3% |
| Ecuadorians | 10.5 /100 | #211 | Poor 33.3% |
| Celtics | 10.2 /100 | #212 | Poor 33.3% |