Italian vs U.S. Virgin Islander Births to Unmarried Women
COMPARE
Italian
U.S. Virgin Islander
Births to Unmarried Women
Births to Unmarried Women Comparison
Italians
U.S. Virgin Islanders
30.8%
BIRTHS TO UNMARRIED WOMEN
77.0/ 100
METRIC RATING
151st/ 347
METRIC RANK
39.6%
BIRTHS TO UNMARRIED WOMEN
0.0/ 100
METRIC RATING
312th/ 347
METRIC RANK
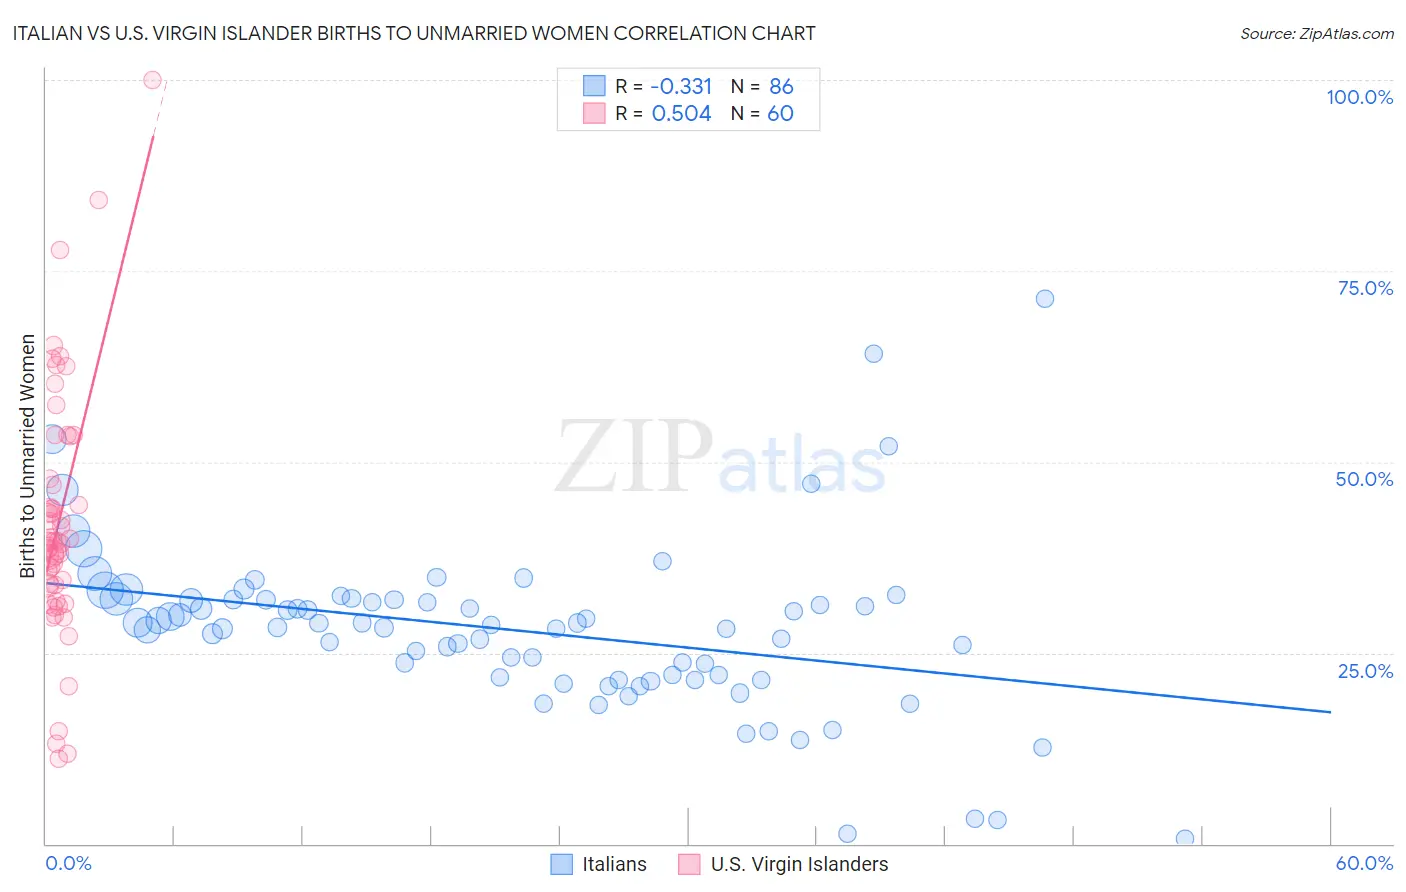
Italian vs U.S. Virgin Islander Births to Unmarried Women Correlation Chart
The statistical analysis conducted on geographies consisting of 508,502,070 people shows a mild negative correlation between the proportion of Italians and percentage of births to unmarried women in the United States with a correlation coefficient (R) of -0.331 and weighted average of 30.8%. Similarly, the statistical analysis conducted on geographies consisting of 86,503,849 people shows a substantial positive correlation between the proportion of U.S. Virgin Islanders and percentage of births to unmarried women in the United States with a correlation coefficient (R) of 0.504 and weighted average of 39.6%, a difference of 28.6%.
Births to Unmarried Women Correlation Summary
| Measurement | Italian | U.S. Virgin Islander |
| Minimum | 0.60% | 11.2% |
| Maximum | 71.4% | 100.0% |
| Range | 70.8% | 88.8% |
| Mean | 28.0% | 42.2% |
| Median | 28.5% | 39.6% |
| Interquartile 25% (IQ1) | 21.7% | 33.9% |
| Interquartile 75% (IQ3) | 31.9% | 47.4% |
| Interquartile Range (IQR) | 10.2% | 13.5% |
| Standard Deviation (Sample) | 11.2% | 16.2% |
| Standard Deviation (Population) | 11.1% | 16.1% |
Similar Demographics by Births to Unmarried Women
Demographics Similar to Italians by Births to Unmarried Women
In terms of births to unmarried women, the demographic groups most similar to Italians are Somali (30.7%, a difference of 0.11%), Polish (30.8%, a difference of 0.11%), British (30.8%, a difference of 0.13%), Yugoslavian (30.8%, a difference of 0.25%), and Serbian (30.7%, a difference of 0.26%).
| Demographics | Rating | Rank | Births to Unmarried Women |
| Czechs | 82.1 /100 | #144 | Excellent 30.5% |
| Immigrants | North America | 81.5 /100 | #145 | Excellent 30.6% |
| Northern Europeans | 81.4 /100 | #146 | Excellent 30.6% |
| Immigrants | Oceania | 81.2 /100 | #147 | Excellent 30.6% |
| Chileans | 79.1 /100 | #148 | Good 30.7% |
| Serbians | 78.8 /100 | #149 | Good 30.7% |
| Somalis | 77.8 /100 | #150 | Good 30.7% |
| Italians | 77.0 /100 | #151 | Good 30.8% |
| Poles | 76.2 /100 | #152 | Good 30.8% |
| British | 76.0 /100 | #153 | Good 30.8% |
| Yugoslavians | 75.1 /100 | #154 | Good 30.8% |
| Immigrants | Bangladesh | 73.9 /100 | #155 | Good 30.9% |
| Carpatho Rusyns | 73.5 /100 | #156 | Good 30.9% |
| Immigrants | Eastern Africa | 72.1 /100 | #157 | Good 31.0% |
| Austrians | 69.9 /100 | #158 | Good 31.0% |
Demographics Similar to U.S. Virgin Islanders by Births to Unmarried Women
In terms of births to unmarried women, the demographic groups most similar to U.S. Virgin Islanders are Immigrants from the Azores (39.6%, a difference of 0.020%), Immigrants from Dominica (39.5%, a difference of 0.25%), African (39.7%, a difference of 0.34%), Cuban (39.4%, a difference of 0.48%), and Aleut (39.3%, a difference of 0.60%).
| Demographics | Rating | Rank | Births to Unmarried Women |
| Immigrants | Haiti | 0.0 /100 | #305 | Tragic 38.9% |
| Central American Indians | 0.0 /100 | #306 | Tragic 39.0% |
| Immigrants | Honduras | 0.0 /100 | #307 | Tragic 39.3% |
| Aleuts | 0.0 /100 | #308 | Tragic 39.3% |
| Cubans | 0.0 /100 | #309 | Tragic 39.4% |
| Immigrants | Dominica | 0.0 /100 | #310 | Tragic 39.5% |
| Immigrants | Azores | 0.0 /100 | #311 | Tragic 39.6% |
| U.S. Virgin Islanders | 0.0 /100 | #312 | Tragic 39.6% |
| Africans | 0.0 /100 | #313 | Tragic 39.7% |
| Immigrants | Caribbean | 0.0 /100 | #314 | Tragic 39.8% |
| Dominicans | 0.0 /100 | #315 | Tragic 39.8% |
| Apache | 0.0 /100 | #316 | Tragic 39.9% |
| Immigrants | Dominican Republic | 0.0 /100 | #317 | Tragic 40.1% |
| Immigrants | Bahamas | 0.0 /100 | #318 | Tragic 40.1% |
| Yakama | 0.0 /100 | #319 | Tragic 40.3% |