Bhutanese vs German Russian Births to Unmarried Women
COMPARE
Bhutanese
German Russian
Births to Unmarried Women
Births to Unmarried Women Comparison
Bhutanese
German Russians
27.9%
BIRTHS TO UNMARRIED WOMEN
99.4/ 100
METRIC RATING
52nd/ 347
METRIC RANK
33.1%
BIRTHS TO UNMARRIED WOMEN
13.1/ 100
METRIC RATING
205th/ 347
METRIC RANK
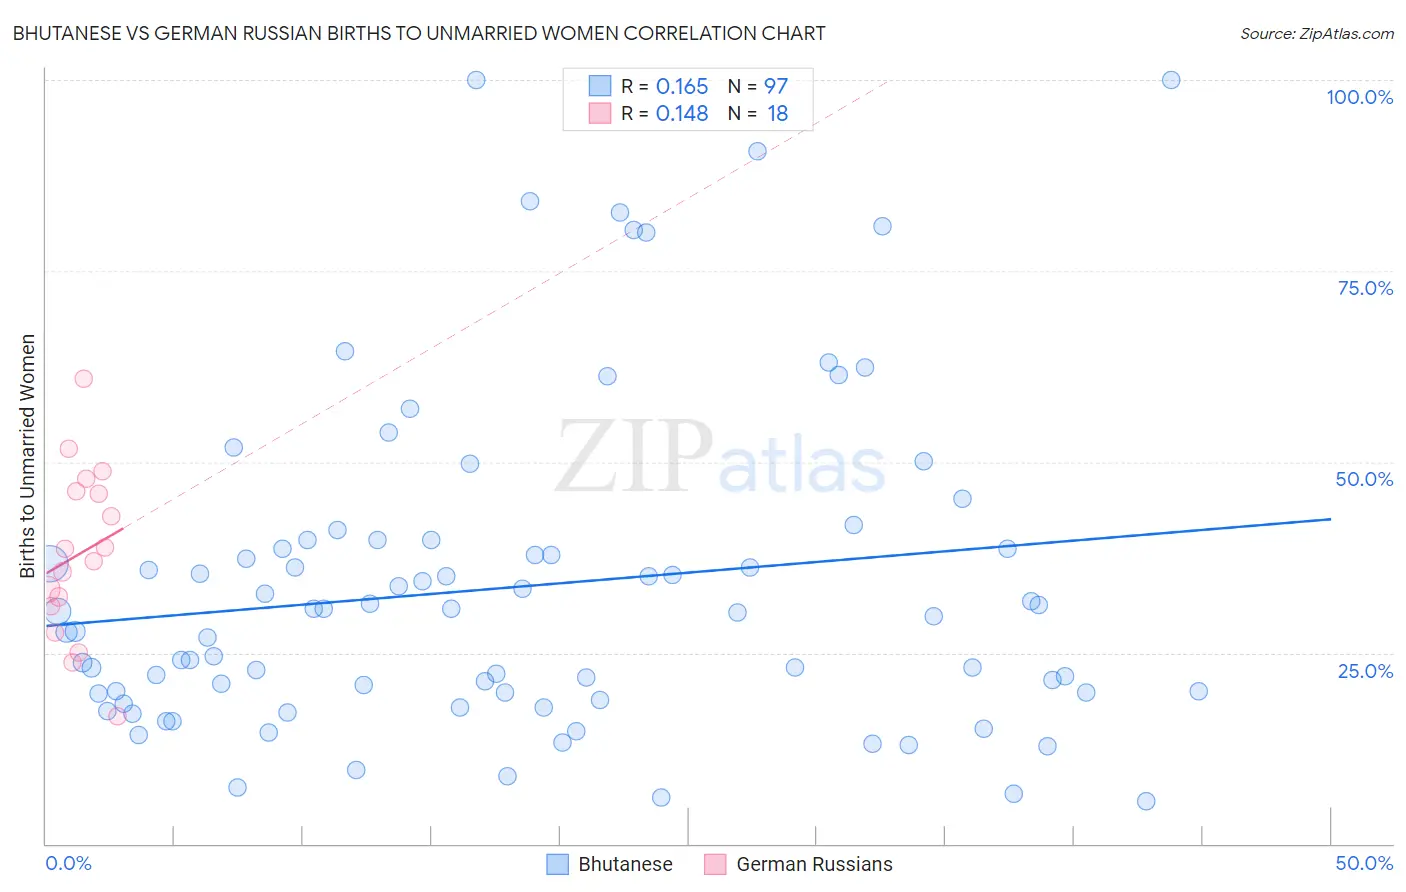
Bhutanese vs German Russian Births to Unmarried Women Correlation Chart
The statistical analysis conducted on geographies consisting of 420,866,190 people shows a poor positive correlation between the proportion of Bhutanese and percentage of births to unmarried women in the United States with a correlation coefficient (R) of 0.165 and weighted average of 27.9%. Similarly, the statistical analysis conducted on geographies consisting of 94,648,089 people shows a poor positive correlation between the proportion of German Russians and percentage of births to unmarried women in the United States with a correlation coefficient (R) of 0.148 and weighted average of 33.1%, a difference of 18.7%.
Births to Unmarried Women Correlation Summary
| Measurement | Bhutanese | German Russian |
| Minimum | 5.5% | 16.7% |
| Maximum | 100.0% | 60.9% |
| Range | 94.5% | 44.2% |
| Mean | 33.6% | 38.0% |
| Median | 30.3% | 37.8% |
| Interquartile 25% (IQ1) | 19.7% | 31.1% |
| Interquartile 75% (IQ3) | 39.2% | 46.1% |
| Interquartile Range (IQR) | 19.4% | 15.1% |
| Standard Deviation (Sample) | 21.1% | 11.2% |
| Standard Deviation (Population) | 21.0% | 10.8% |
Similar Demographics by Births to Unmarried Women
Demographics Similar to Bhutanese by Births to Unmarried Women
In terms of births to unmarried women, the demographic groups most similar to Bhutanese are Immigrants from Romania (27.9%, a difference of 0.020%), Macedonian (27.9%, a difference of 0.040%), Afghan (27.9%, a difference of 0.090%), Mongolian (27.9%, a difference of 0.12%), and Maltese (27.8%, a difference of 0.17%).
| Demographics | Rating | Rank | Births to Unmarried Women |
| Latvians | 99.5 /100 | #45 | Exceptional 27.7% |
| Immigrants | Lithuania | 99.5 /100 | #46 | Exceptional 27.7% |
| Hmong | 99.5 /100 | #47 | Exceptional 27.7% |
| Eastern Europeans | 99.5 /100 | #48 | Exceptional 27.7% |
| Immigrants | Greece | 99.4 /100 | #49 | Exceptional 27.8% |
| Maltese | 99.4 /100 | #50 | Exceptional 27.8% |
| Macedonians | 99.4 /100 | #51 | Exceptional 27.9% |
| Bhutanese | 99.4 /100 | #52 | Exceptional 27.9% |
| Immigrants | Romania | 99.4 /100 | #53 | Exceptional 27.9% |
| Afghans | 99.4 /100 | #54 | Exceptional 27.9% |
| Mongolians | 99.3 /100 | #55 | Exceptional 27.9% |
| Immigrants | Belgium | 99.3 /100 | #56 | Exceptional 28.0% |
| Russians | 99.2 /100 | #57 | Exceptional 28.0% |
| Immigrants | Albania | 99.2 /100 | #58 | Exceptional 28.0% |
| Immigrants | Kazakhstan | 99.1 /100 | #59 | Exceptional 28.1% |
Demographics Similar to German Russians by Births to Unmarried Women
In terms of births to unmarried women, the demographic groups most similar to German Russians are Uruguayan (33.1%, a difference of 0.060%), Immigrants from Africa (33.0%, a difference of 0.23%), Ute (33.0%, a difference of 0.25%), Immigrants from Sudan (33.2%, a difference of 0.34%), and Hawaiian (33.2%, a difference of 0.38%).
| Demographics | Rating | Rank | Births to Unmarried Women |
| Costa Ricans | 20.3 /100 | #198 | Fair 32.7% |
| Immigrants | Thailand | 18.9 /100 | #199 | Poor 32.8% |
| Immigrants | Germany | 18.8 /100 | #200 | Poor 32.8% |
| Immigrants | Burma/Myanmar | 16.7 /100 | #201 | Poor 32.9% |
| Immigrants | Micronesia | 16.6 /100 | #202 | Poor 32.9% |
| Ute | 14.4 /100 | #203 | Poor 33.0% |
| Immigrants | Africa | 14.3 /100 | #204 | Poor 33.0% |
| German Russians | 13.1 /100 | #205 | Poor 33.1% |
| Uruguayans | 12.8 /100 | #206 | Poor 33.1% |
| Immigrants | Sudan | 11.5 /100 | #207 | Poor 33.2% |
| Hawaiians | 11.3 /100 | #208 | Poor 33.2% |
| Whites/Caucasians | 10.7 /100 | #209 | Poor 33.3% |
| Scotch-Irish | 10.7 /100 | #210 | Poor 33.3% |
| Ecuadorians | 10.5 /100 | #211 | Poor 33.3% |
| Celtics | 10.2 /100 | #212 | Poor 33.3% |