Italian vs German Russian Professional Degree
COMPARE
Italian
German Russian
Professional Degree
Professional Degree Comparison
Italians
German Russians
4.8%
PROFESSIONAL DEGREE
90.2/ 100
METRIC RATING
133rd/ 347
METRIC RANK
4.0%
PROFESSIONAL DEGREE
6.1/ 100
METRIC RATING
226th/ 347
METRIC RANK
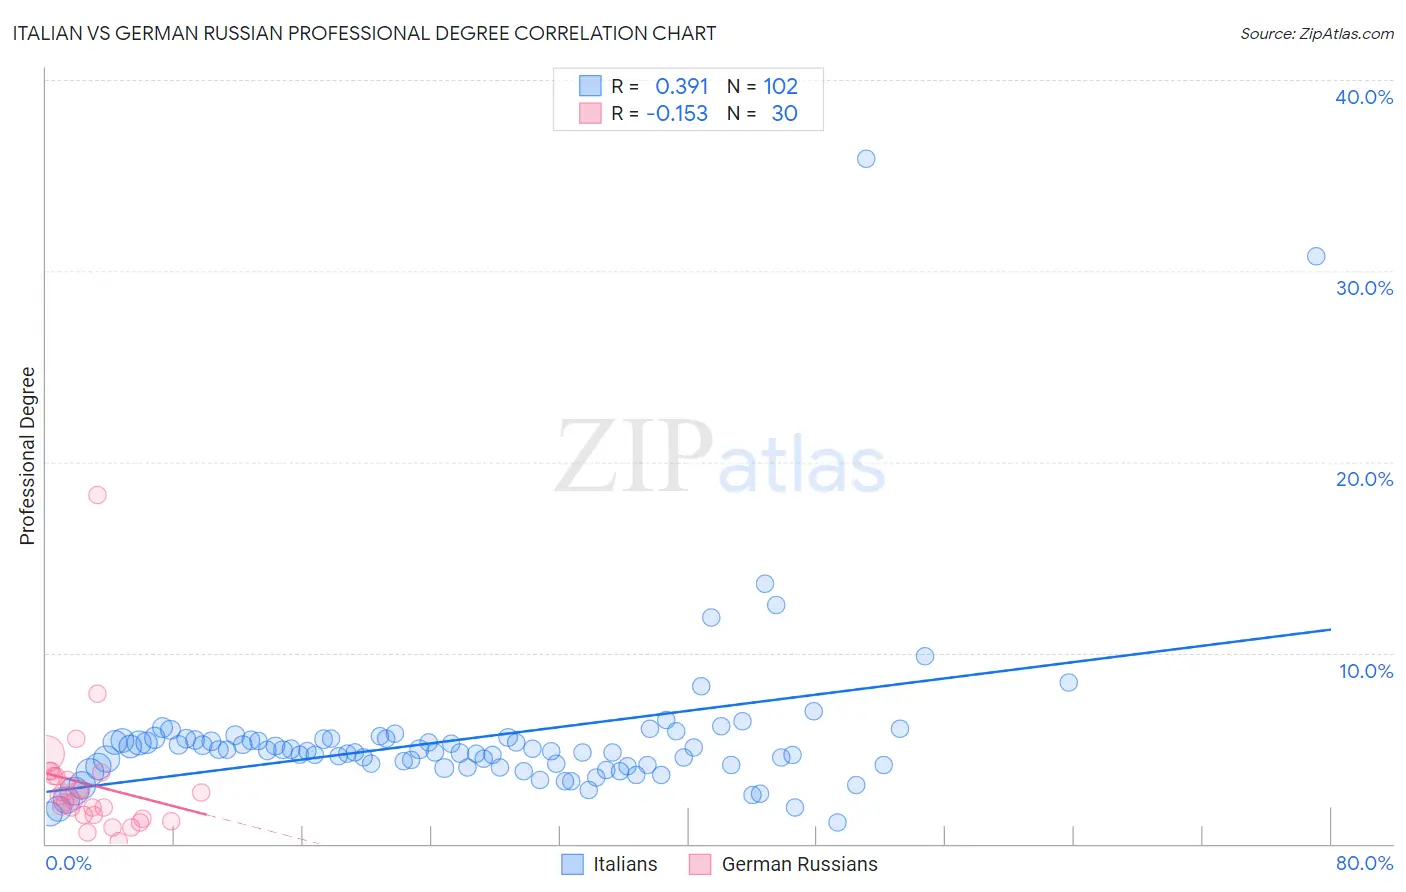
Italian vs German Russian Professional Degree Correlation Chart
The statistical analysis conducted on geographies consisting of 566,305,731 people shows a mild positive correlation between the proportion of Italians and percentage of population with at least professional degree education in the United States with a correlation coefficient (R) of 0.391 and weighted average of 4.8%. Similarly, the statistical analysis conducted on geographies consisting of 96,360,992 people shows a poor negative correlation between the proportion of German Russians and percentage of population with at least professional degree education in the United States with a correlation coefficient (R) of -0.153 and weighted average of 4.0%, a difference of 20.0%.
Professional Degree Correlation Summary
| Measurement | Italian | German Russian |
| Minimum | 1.1% | 0.15% |
| Maximum | 35.9% | 18.3% |
| Range | 34.7% | 18.2% |
| Mean | 5.5% | 3.1% |
| Median | 4.9% | 2.4% |
| Interquartile 25% (IQ1) | 4.1% | 1.5% |
| Interquartile 75% (IQ3) | 5.5% | 3.6% |
| Interquartile Range (IQR) | 1.4% | 2.1% |
| Standard Deviation (Sample) | 4.4% | 3.3% |
| Standard Deviation (Population) | 4.4% | 3.2% |
Similar Demographics by Professional Degree
Demographics Similar to Italians by Professional Degree
In terms of professional degree, the demographic groups most similar to Italians are South American Indian (4.8%, a difference of 0.12%), Macedonian (4.8%, a difference of 0.16%), Pakistani (4.8%, a difference of 0.25%), Immigrants from Jordan (4.7%, a difference of 0.44%), and Jordanian (4.7%, a difference of 0.46%).
| Demographics | Rating | Rank | Professional Degree |
| Europeans | 93.2 /100 | #126 | Exceptional 4.8% |
| Serbians | 92.6 /100 | #127 | Exceptional 4.8% |
| Immigrants | Eastern Africa | 92.5 /100 | #128 | Exceptional 4.8% |
| Palestinians | 91.5 /100 | #129 | Exceptional 4.8% |
| Icelanders | 91.5 /100 | #130 | Exceptional 4.8% |
| Immigrants | Nepal | 91.4 /100 | #131 | Exceptional 4.8% |
| Pakistanis | 90.9 /100 | #132 | Exceptional 4.8% |
| Italians | 90.2 /100 | #133 | Exceptional 4.8% |
| South American Indians | 89.9 /100 | #134 | Excellent 4.8% |
| Macedonians | 89.8 /100 | #135 | Excellent 4.8% |
| Immigrants | Jordan | 89.0 /100 | #136 | Excellent 4.7% |
| Jordanians | 88.9 /100 | #137 | Excellent 4.7% |
| Afghans | 88.8 /100 | #138 | Excellent 4.7% |
| South Americans | 85.6 /100 | #139 | Excellent 4.7% |
| Canadians | 84.4 /100 | #140 | Excellent 4.7% |
Demographics Similar to German Russians by Professional Degree
In terms of professional degree, the demographic groups most similar to German Russians are Cuban (4.0%, a difference of 0.12%), Immigrants from West Indies (4.0%, a difference of 0.37%), Immigrants from Burma/Myanmar (3.9%, a difference of 0.52%), Tlingit-Haida (4.0%, a difference of 0.55%), and Trinidadian and Tobagonian (4.0%, a difference of 0.68%).
| Demographics | Rating | Rank | Professional Degree |
| Immigrants | South Eastern Asia | 8.9 /100 | #219 | Tragic 4.0% |
| Ute | 8.2 /100 | #220 | Tragic 4.0% |
| French Canadians | 8.0 /100 | #221 | Tragic 4.0% |
| Immigrants | Western Africa | 7.5 /100 | #222 | Tragic 4.0% |
| Immigrants | Bosnia and Herzegovina | 7.4 /100 | #223 | Tragic 4.0% |
| Trinidadians and Tobagonians | 7.1 /100 | #224 | Tragic 4.0% |
| Tlingit-Haida | 6.9 /100 | #225 | Tragic 4.0% |
| German Russians | 6.1 /100 | #226 | Tragic 4.0% |
| Cubans | 5.9 /100 | #227 | Tragic 4.0% |
| Immigrants | West Indies | 5.6 /100 | #228 | Tragic 4.0% |
| Immigrants | Burma/Myanmar | 5.4 /100 | #229 | Tragic 3.9% |
| Nicaraguans | 5.1 /100 | #230 | Tragic 3.9% |
| Ecuadorians | 4.6 /100 | #231 | Tragic 3.9% |
| Cree | 4.3 /100 | #232 | Tragic 3.9% |
| Immigrants | Philippines | 4.1 /100 | #233 | Tragic 3.9% |