Italian vs Yuman Births to Unmarried Women
COMPARE
Italian
Yuman
Births to Unmarried Women
Births to Unmarried Women Comparison
Italians
Yuman
30.8%
BIRTHS TO UNMARRIED WOMEN
77.0/ 100
METRIC RATING
151st/ 347
METRIC RANK
44.4%
BIRTHS TO UNMARRIED WOMEN
0.0/ 100
METRIC RATING
334th/ 347
METRIC RANK
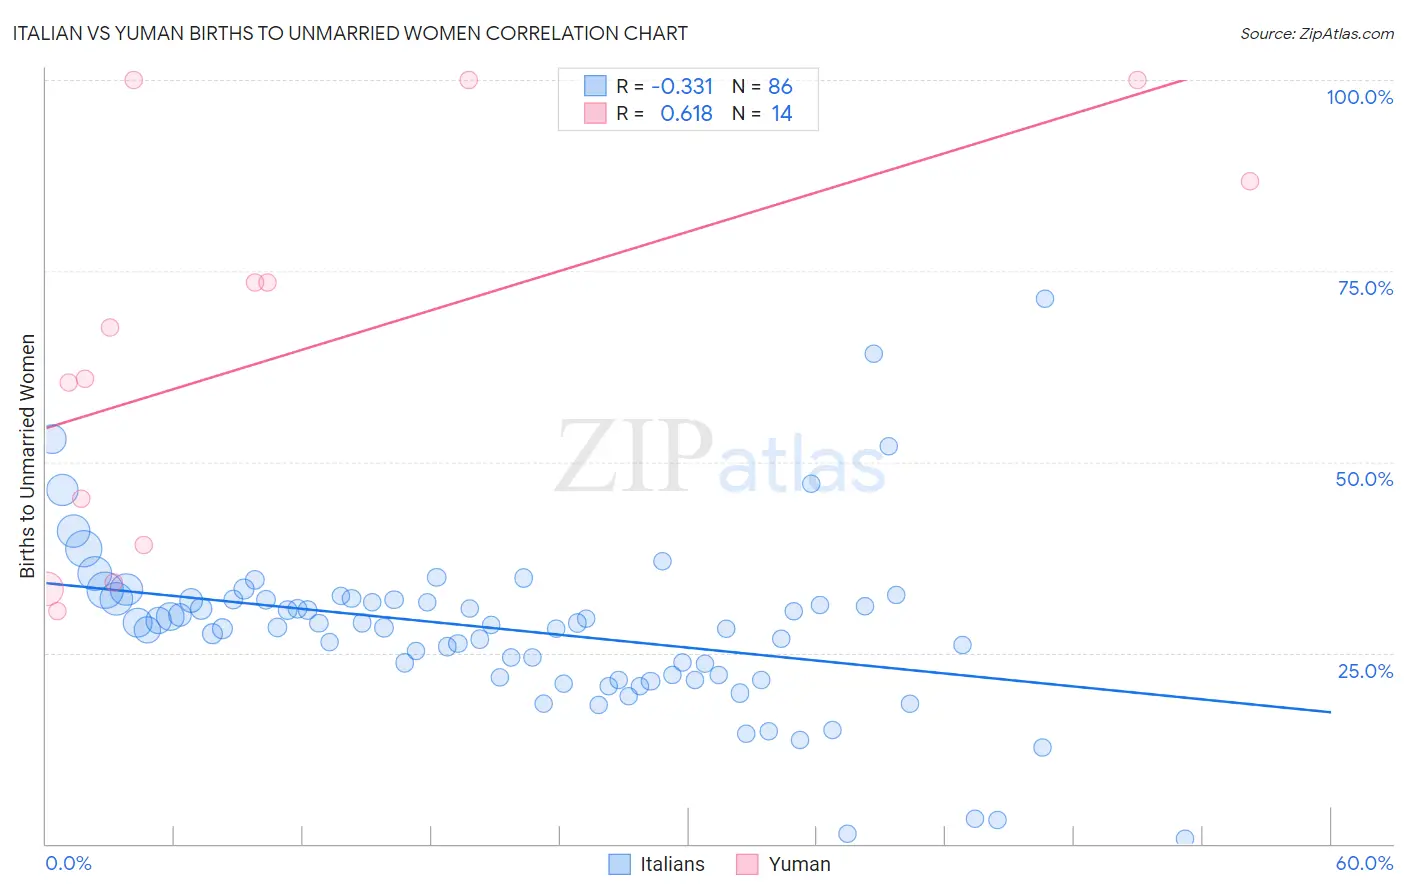
Italian vs Yuman Births to Unmarried Women Correlation Chart
The statistical analysis conducted on geographies consisting of 508,502,070 people shows a mild negative correlation between the proportion of Italians and percentage of births to unmarried women in the United States with a correlation coefficient (R) of -0.331 and weighted average of 30.8%. Similarly, the statistical analysis conducted on geographies consisting of 40,299,721 people shows a significant positive correlation between the proportion of Yuman and percentage of births to unmarried women in the United States with a correlation coefficient (R) of 0.618 and weighted average of 44.4%, a difference of 44.2%.
Births to Unmarried Women Correlation Summary
| Measurement | Italian | Yuman |
| Minimum | 0.60% | 30.5% |
| Maximum | 71.4% | 100.0% |
| Range | 70.8% | 69.5% |
| Mean | 28.0% | 64.7% |
| Median | 28.5% | 64.3% |
| Interquartile 25% (IQ1) | 21.7% | 39.1% |
| Interquartile 75% (IQ3) | 31.9% | 86.7% |
| Interquartile Range (IQR) | 10.2% | 47.6% |
| Standard Deviation (Sample) | 11.2% | 25.6% |
| Standard Deviation (Population) | 11.1% | 24.7% |
Similar Demographics by Births to Unmarried Women
Demographics Similar to Italians by Births to Unmarried Women
In terms of births to unmarried women, the demographic groups most similar to Italians are Somali (30.7%, a difference of 0.11%), Polish (30.8%, a difference of 0.11%), British (30.8%, a difference of 0.13%), Yugoslavian (30.8%, a difference of 0.25%), and Serbian (30.7%, a difference of 0.26%).
| Demographics | Rating | Rank | Births to Unmarried Women |
| Czechs | 82.1 /100 | #144 | Excellent 30.5% |
| Immigrants | North America | 81.5 /100 | #145 | Excellent 30.6% |
| Northern Europeans | 81.4 /100 | #146 | Excellent 30.6% |
| Immigrants | Oceania | 81.2 /100 | #147 | Excellent 30.6% |
| Chileans | 79.1 /100 | #148 | Good 30.7% |
| Serbians | 78.8 /100 | #149 | Good 30.7% |
| Somalis | 77.8 /100 | #150 | Good 30.7% |
| Italians | 77.0 /100 | #151 | Good 30.8% |
| Poles | 76.2 /100 | #152 | Good 30.8% |
| British | 76.0 /100 | #153 | Good 30.8% |
| Yugoslavians | 75.1 /100 | #154 | Good 30.8% |
| Immigrants | Bangladesh | 73.9 /100 | #155 | Good 30.9% |
| Carpatho Rusyns | 73.5 /100 | #156 | Good 30.9% |
| Immigrants | Eastern Africa | 72.1 /100 | #157 | Good 31.0% |
| Austrians | 69.9 /100 | #158 | Good 31.0% |
Demographics Similar to Yuman by Births to Unmarried Women
In terms of births to unmarried women, the demographic groups most similar to Yuman are Black/African American (44.3%, a difference of 0.17%), Colville (45.3%, a difference of 2.1%), Kiowa (43.1%, a difference of 2.9%), Puerto Rican (45.7%, a difference of 2.9%), and Native/Alaskan (43.0%, a difference of 3.2%).
| Demographics | Rating | Rank | Births to Unmarried Women |
| Tsimshian | 0.0 /100 | #327 | Tragic 42.2% |
| Immigrants | Cabo Verde | 0.0 /100 | #328 | Tragic 42.2% |
| Paiute | 0.0 /100 | #329 | Tragic 42.5% |
| Chippewa | 0.0 /100 | #330 | Tragic 42.6% |
| Natives/Alaskans | 0.0 /100 | #331 | Tragic 43.0% |
| Kiowa | 0.0 /100 | #332 | Tragic 43.1% |
| Blacks/African Americans | 0.0 /100 | #333 | Tragic 44.3% |
| Yuman | 0.0 /100 | #334 | Tragic 44.4% |
| Colville | 0.0 /100 | #335 | Tragic 45.3% |
| Puerto Ricans | 0.0 /100 | #336 | Tragic 45.7% |
| Houma | 0.0 /100 | #337 | Tragic 46.6% |
| Arapaho | 0.0 /100 | #338 | Tragic 47.1% |
| Lumbee | 0.0 /100 | #339 | Tragic 48.2% |
| Tohono O'odham | 0.0 /100 | #340 | Tragic 49.8% |
| Hopi | 0.0 /100 | #341 | Tragic 50.8% |