Italian vs Subsaharan African Births to Unmarried Women
COMPARE
Italian
Subsaharan African
Births to Unmarried Women
Births to Unmarried Women Comparison
Italians
Sub-Saharan Africans
30.8%
BIRTHS TO UNMARRIED WOMEN
77.0/ 100
METRIC RATING
151st/ 347
METRIC RANK
36.7%
BIRTHS TO UNMARRIED WOMEN
0.1/ 100
METRIC RATING
264th/ 347
METRIC RANK
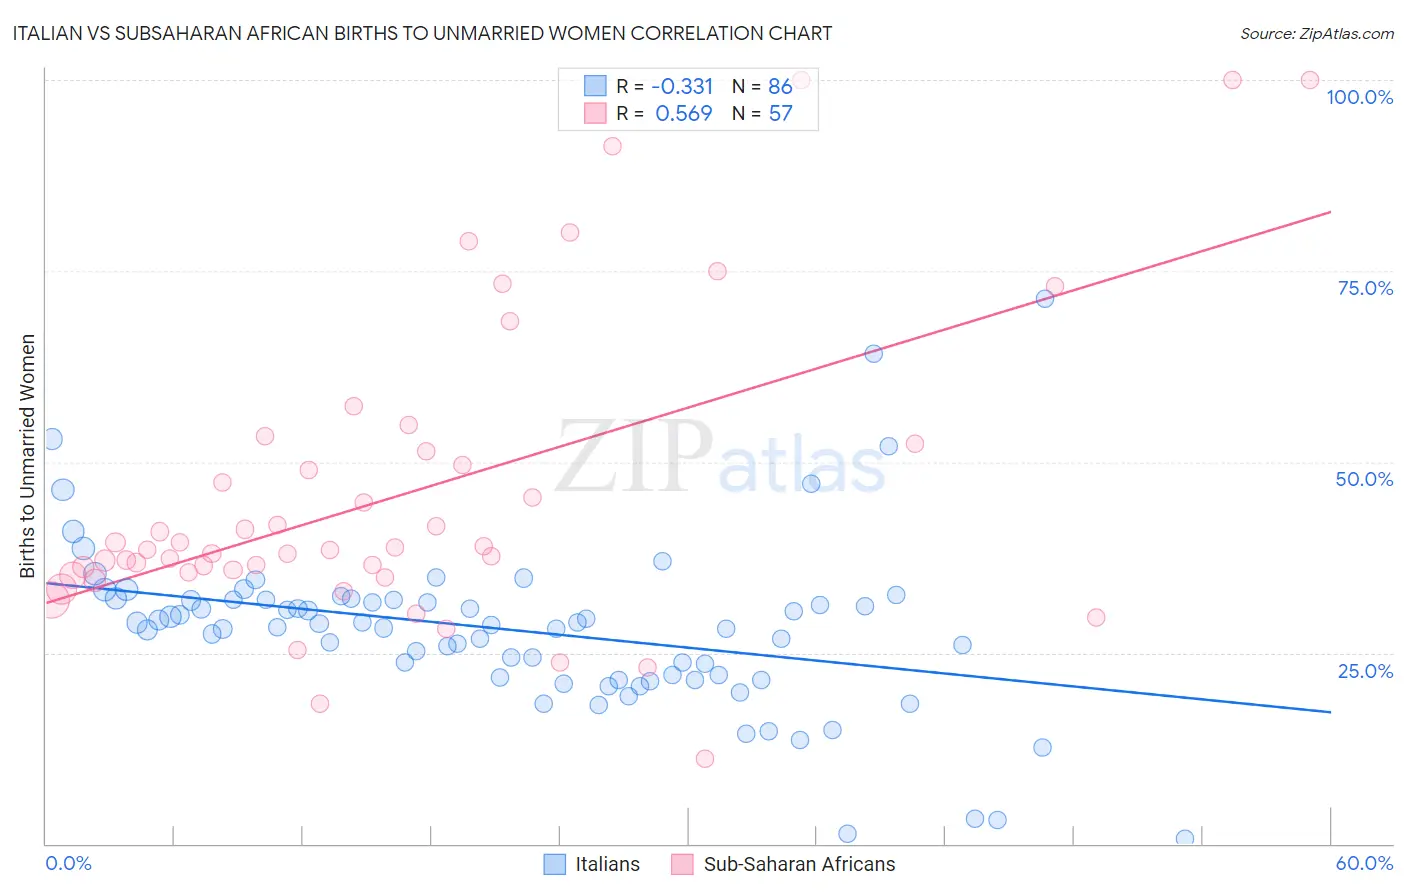
Italian vs Subsaharan African Births to Unmarried Women Correlation Chart
The statistical analysis conducted on geographies consisting of 508,502,070 people shows a mild negative correlation between the proportion of Italians and percentage of births to unmarried women in the United States with a correlation coefficient (R) of -0.331 and weighted average of 30.8%. Similarly, the statistical analysis conducted on geographies consisting of 468,897,335 people shows a substantial positive correlation between the proportion of Sub-Saharan Africans and percentage of births to unmarried women in the United States with a correlation coefficient (R) of 0.569 and weighted average of 36.7%, a difference of 19.1%.
Births to Unmarried Women Correlation Summary
| Measurement | Italian | Subsaharan African |
| Minimum | 0.60% | 11.1% |
| Maximum | 71.4% | 100.0% |
| Range | 70.8% | 88.9% |
| Mean | 28.0% | 45.9% |
| Median | 28.5% | 38.5% |
| Interquartile 25% (IQ1) | 21.7% | 35.3% |
| Interquartile 75% (IQ3) | 31.9% | 51.9% |
| Interquartile Range (IQR) | 10.2% | 16.5% |
| Standard Deviation (Sample) | 11.2% | 20.2% |
| Standard Deviation (Population) | 11.1% | 20.0% |
Similar Demographics by Births to Unmarried Women
Demographics Similar to Italians by Births to Unmarried Women
In terms of births to unmarried women, the demographic groups most similar to Italians are Somali (30.7%, a difference of 0.11%), Polish (30.8%, a difference of 0.11%), British (30.8%, a difference of 0.13%), Yugoslavian (30.8%, a difference of 0.25%), and Serbian (30.7%, a difference of 0.26%).
| Demographics | Rating | Rank | Births to Unmarried Women |
| Czechs | 82.1 /100 | #144 | Excellent 30.5% |
| Immigrants | North America | 81.5 /100 | #145 | Excellent 30.6% |
| Northern Europeans | 81.4 /100 | #146 | Excellent 30.6% |
| Immigrants | Oceania | 81.2 /100 | #147 | Excellent 30.6% |
| Chileans | 79.1 /100 | #148 | Good 30.7% |
| Serbians | 78.8 /100 | #149 | Good 30.7% |
| Somalis | 77.8 /100 | #150 | Good 30.7% |
| Italians | 77.0 /100 | #151 | Good 30.8% |
| Poles | 76.2 /100 | #152 | Good 30.8% |
| British | 76.0 /100 | #153 | Good 30.8% |
| Yugoslavians | 75.1 /100 | #154 | Good 30.8% |
| Immigrants | Bangladesh | 73.9 /100 | #155 | Good 30.9% |
| Carpatho Rusyns | 73.5 /100 | #156 | Good 30.9% |
| Immigrants | Eastern Africa | 72.1 /100 | #157 | Good 31.0% |
| Austrians | 69.9 /100 | #158 | Good 31.0% |
Demographics Similar to Sub-Saharan Africans by Births to Unmarried Women
In terms of births to unmarried women, the demographic groups most similar to Sub-Saharan Africans are Cherokee (36.7%, a difference of 0.050%), Immigrants from Senegal (36.7%, a difference of 0.10%), Nicaraguan (36.6%, a difference of 0.12%), French American Indian (36.6%, a difference of 0.14%), and Central American (36.7%, a difference of 0.17%).
| Demographics | Rating | Rank | Births to Unmarried Women |
| Immigrants | Grenada | 0.2 /100 | #257 | Tragic 36.3% |
| Americans | 0.2 /100 | #258 | Tragic 36.4% |
| Immigrants | El Salvador | 0.2 /100 | #259 | Tragic 36.4% |
| Ottawa | 0.2 /100 | #260 | Tragic 36.5% |
| Trinidadians and Tobagonians | 0.2 /100 | #261 | Tragic 36.5% |
| French American Indians | 0.1 /100 | #262 | Tragic 36.6% |
| Nicaraguans | 0.1 /100 | #263 | Tragic 36.6% |
| Sub-Saharan Africans | 0.1 /100 | #264 | Tragic 36.7% |
| Cherokee | 0.1 /100 | #265 | Tragic 36.7% |
| Immigrants | Senegal | 0.1 /100 | #266 | Tragic 36.7% |
| Central Americans | 0.1 /100 | #267 | Tragic 36.7% |
| Comanche | 0.1 /100 | #268 | Tragic 36.7% |
| Senegalese | 0.1 /100 | #269 | Tragic 36.8% |
| Immigrants | Congo | 0.1 /100 | #270 | Tragic 36.8% |
| Immigrants | Barbados | 0.1 /100 | #271 | Tragic 36.8% |