Iranian vs Immigrants from Kenya Single Father Households
COMPARE
Iranian
Immigrants from Kenya
Single Father Households
Single Father Households Comparison
Iranians
Immigrants from Kenya
1.9%
SINGLE FATHER HOUSEHOLDS
100.0/ 100
METRIC RATING
19th/ 347
METRIC RANK
2.4%
SINGLE FATHER HOUSEHOLDS
20.3/ 100
METRIC RATING
208th/ 347
METRIC RANK
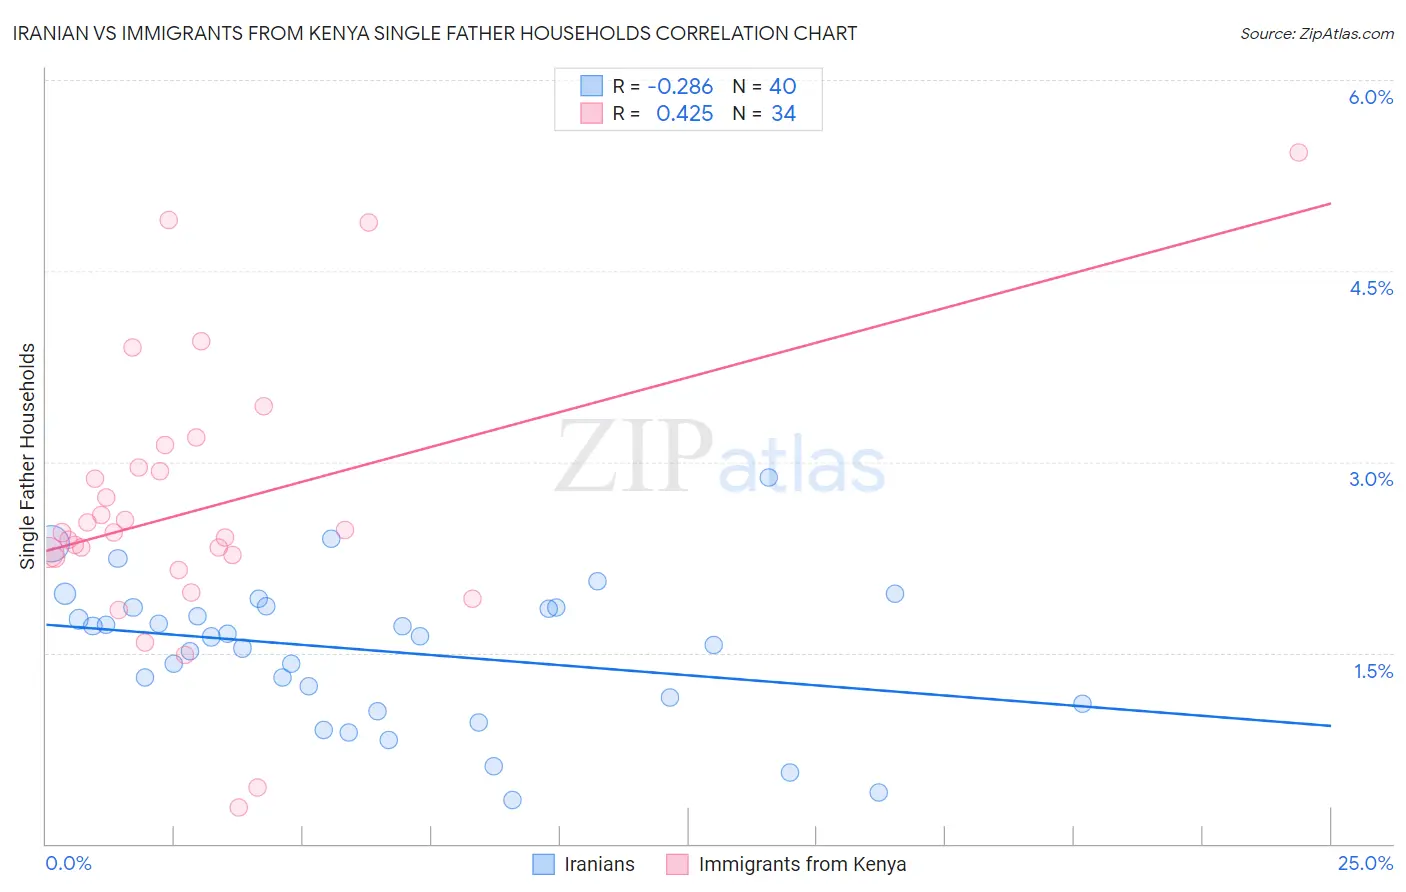
Iranian vs Immigrants from Kenya Single Father Households Correlation Chart
The statistical analysis conducted on geographies consisting of 314,844,289 people shows a weak negative correlation between the proportion of Iranians and percentage of single father households in the United States with a correlation coefficient (R) of -0.286 and weighted average of 1.9%. Similarly, the statistical analysis conducted on geographies consisting of 217,370,278 people shows a moderate positive correlation between the proportion of Immigrants from Kenya and percentage of single father households in the United States with a correlation coefficient (R) of 0.425 and weighted average of 2.4%, a difference of 24.7%.
Single Father Households Correlation Summary
| Measurement | Iranian | Immigrants from Kenya |
| Minimum | 0.34% | 0.28% |
| Maximum | 2.9% | 5.4% |
| Range | 2.5% | 5.2% |
| Mean | 1.5% | 2.6% |
| Median | 1.6% | 2.4% |
| Interquartile 25% (IQ1) | 1.1% | 2.2% |
| Interquartile 75% (IQ3) | 1.9% | 3.0% |
| Interquartile Range (IQR) | 0.73% | 0.71% |
| Standard Deviation (Sample) | 0.56% | 1.1% |
| Standard Deviation (Population) | 0.55% | 1.1% |
Similar Demographics by Single Father Households
Demographics Similar to Iranians by Single Father Households
In terms of single father households, the demographic groups most similar to Iranians are Thai (1.9%, a difference of 0.070%), Immigrants from Albania (1.9%, a difference of 0.37%), Immigrants from Latvia (1.9%, a difference of 0.56%), Indian (Asian) (1.9%, a difference of 0.84%), and Immigrants from India (1.9%, a difference of 1.3%).
| Demographics | Rating | Rank | Single Father Households |
| Immigrants | Greece | 100.0 /100 | #12 | Exceptional 1.9% |
| Immigrants | Singapore | 100.0 /100 | #13 | Exceptional 1.9% |
| Immigrants | Lithuania | 100.0 /100 | #14 | Exceptional 1.9% |
| Immigrants | Eastern Asia | 100.0 /100 | #15 | Exceptional 1.9% |
| Immigrants | Iran | 100.0 /100 | #16 | Exceptional 1.9% |
| Immigrants | India | 100.0 /100 | #17 | Exceptional 1.9% |
| Indians (Asian) | 100.0 /100 | #18 | Exceptional 1.9% |
| Iranians | 100.0 /100 | #19 | Exceptional 1.9% |
| Thais | 100.0 /100 | #20 | Exceptional 1.9% |
| Immigrants | Albania | 100.0 /100 | #21 | Exceptional 1.9% |
| Immigrants | Latvia | 100.0 /100 | #22 | Exceptional 1.9% |
| Immigrants | Croatia | 100.0 /100 | #23 | Exceptional 2.0% |
| Immigrants | Russia | 100.0 /100 | #24 | Exceptional 2.0% |
| Eastern Europeans | 100.0 /100 | #25 | Exceptional 2.0% |
| Assyrians/Chaldeans/Syriacs | 100.0 /100 | #26 | Exceptional 2.0% |
Demographics Similar to Immigrants from Kenya by Single Father Households
In terms of single father households, the demographic groups most similar to Immigrants from Kenya are Immigrants from Peru (2.4%, a difference of 0.12%), Immigrants from Costa Rica (2.4%, a difference of 0.13%), Immigrants from Nigeria (2.4%, a difference of 0.18%), Finnish (2.4%, a difference of 0.23%), and White/Caucasian (2.4%, a difference of 0.25%).
| Demographics | Rating | Rank | Single Father Households |
| Immigrants | Uganda | 26.0 /100 | #201 | Fair 2.4% |
| German Russians | 25.7 /100 | #202 | Fair 2.4% |
| French Canadians | 24.7 /100 | #203 | Fair 2.4% |
| Ecuadorians | 24.5 /100 | #204 | Fair 2.4% |
| Immigrants | Afghanistan | 24.2 /100 | #205 | Fair 2.4% |
| Koreans | 24.1 /100 | #206 | Fair 2.4% |
| Whites/Caucasians | 22.6 /100 | #207 | Fair 2.4% |
| Immigrants | Kenya | 20.3 /100 | #208 | Fair 2.4% |
| Immigrants | Peru | 19.3 /100 | #209 | Poor 2.4% |
| Immigrants | Costa Rica | 19.2 /100 | #210 | Poor 2.4% |
| Immigrants | Nigeria | 18.7 /100 | #211 | Poor 2.4% |
| Finns | 18.3 /100 | #212 | Poor 2.4% |
| Norwegians | 17.1 /100 | #213 | Poor 2.4% |
| Ethiopians | 16.6 /100 | #214 | Poor 2.4% |
| Immigrants | South Eastern Asia | 15.9 /100 | #215 | Poor 2.4% |